
US stocks continued to take it on the chin last week. Amidst this rout that began early October, small-caps last week performed relatively better. Bulls hope this is a signal, not a noise, at least near term.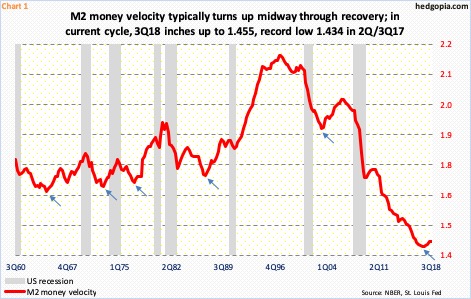
US M2 money velocity continued to inch up in 3Q18, but from a very suppressed level. At 1.455, it rose from 1.434 in both 2Q/3Q last year, which was the lowest in recent history (Chart 1). Velocity – a ratio between GDP and money supply – measures the turnover of the money supply. It is the rate at which people spend money. If velocity is rising, that means more transactions are occurring between individuals in the economy.
Historically, M2 velocity has shown a tendency to turn up mid-cycle. But in a lot of respects, this cycle has been like no other. Macro bulls sure hope history repeats itself and the recent uptrend continues. But it is too soon to conclude (1) if this continues, and (2) even if it does, it will mean the same as it did in the past.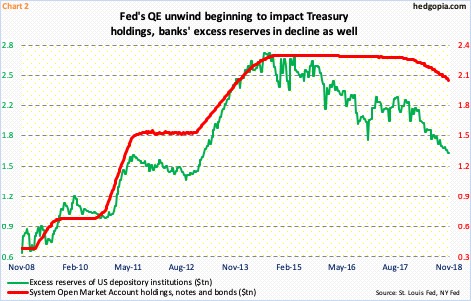
Post-financial crisis, the Fed aggressively loosened monetary policy, pushing the fed funds rate to near zero in 2008 and keeping them there until 2015. It also launched quantitative easing (QE). The central bank’s balance sheet grew from sub-$1 trillion to a high of $4.5 trillion in January 2015. It currently stands at $4.1 trillion.
In the meantime, M2 money supply increased from $8.4 trillion in June 2009, when Great Recession ended, to $14.3 trillion this October, for a 69.3-percent rise. Nominal GDP between 2Q09 and 3Q18 rose 43.9 percent.
A lot of the QE money is sitting idle in excess reserves. The Fed began paying interest – currently 2.2 percent – on these reserves in 2008. Banks currently hold $1.7 trillion worth. Reserves rose as high as $2.7 trillion in August 2014; six years prior to that, they were sub-$2 billion.
Thus, the velocity signal this time around may not be as clean as in the past. Even if it rises in quarters to come, it may be because the Fed’s balance sheet has begun to shrink. In October last year, the Fed began its QE unwind. Beginning this October, the balance sheet is scheduled to shrink by up to $30 billion in treasury securities and up to $20 billion in mortgage-backed securities. As of last Thursday, the bank held $2.1 trillion in Treasury notes and bonds, down from $2.3 trillion in October 2014 (Chart 2). In the meantime, the fed funds rate has had eight 25-basis-point hikes in the past three years, to a range of two to 2.25 percent.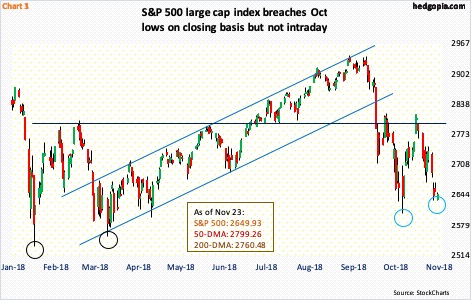
Arguably, the Fed is gradually taking the punch bowl away, or at least attempting to. The acceleration beginning October in the planned balance-sheet reduction dovetailed with a broader selloff in stocks. This could be entirely a coincidence – or not. The bull market is four months short of completing a decade. Realization among market participants that liquidity is not as ample can sap sentiment.
The S&P 500 large cap index (2632.56) reached an intraday all-time high of 2940.91 on September 21. On October 3, it came within 1.06 points of surpassing that high, before unraveling. The waterfall dive that followed would not stop until touching 2603.54 on October 29. A subsequent rally was rejected at 2800, which also acted as a ceiling mid-October (Chart 3).
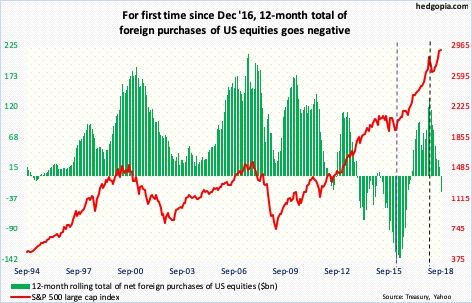
Last week, the index lost another 3.8 percent. On a weekly closing basis, the lows of October have been breached, but not on an intraday basis. Bulls hope to keep it that way. Seasonality does favor them at least in the next several weeks. Medium- to -longer-term, they are facing several headwinds, not the least of which is next year’s elevated earnings expectations, combined with foreigners’ apathy toward US stocks.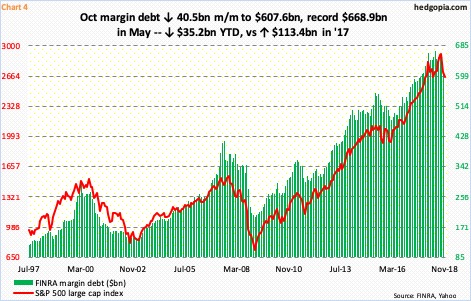
Then there is FINRA margin debt, which, after more-than-a-three-fold jump since the bull market began in March 2009, seems to have hit the wall. From $204 billion back then, it rose to $668.9 billion in May this year. October came in at $607.6 billion, down a hefty $40.5 billion month-over-month. This was the heaviest monthly drawdown in the past decade (Chart 4), lending a hand to the October rout in stocks.
Year-to-October, margin debt is now down $35.2 billion. In contrast, in 2017 it jumped $113.4 billion. Not surprisingly last year, stocks did very well, with the S&P 500 rallying 19.4 percent. The two tend to move in tandem. Given the rise in leverage over the years, unwinding will be painful.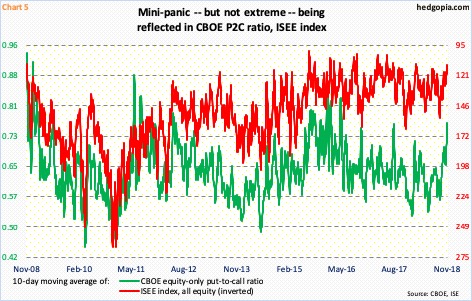
In this respect, the monthly chart of the S&P 500 has decidedly turned lower, and has a long way to go on the downside before overbought conditions are unwound. This is the risk bulls currently face.
Here is the thing. Despite a double-digit decline, there is no panic in the air for a meaningful bottom – similar to when stocks bottomed in February 2016. From that low through September’s record high, the S&P 500 jumped 62.5 percent!
In the week in which the S&P 500 peaked early last month, Investors Intelligence bulls registered 61.8 percent, which was the highest since 66 in late January this year. Last week, bulls dropped to 39.6 percent, even as bears rose to 19.8 percent. In February 2016, bulls’ count shrunk to 24.7 percent, and bears reached 39.8 percent. The spread between the two went negative. Currently, it is positive 19.8 percentage points.
In the options market, too, investor fear is on the rise but shows no panic. There is this, though. Chart 5 plots the 10-day moving average of the CBOE equity-only put-to-call ratio and the ISEE index, all equity. The latter is a call-to-put ratio, hence inverted. Since late September/early October, both have unwound quite a bit of investor optimism that was getting built in. On the CBOE in particular, four out of the past 10 sessions produced readings in the 0.80s and the rest in the 0.70s – kind of a mini-panic.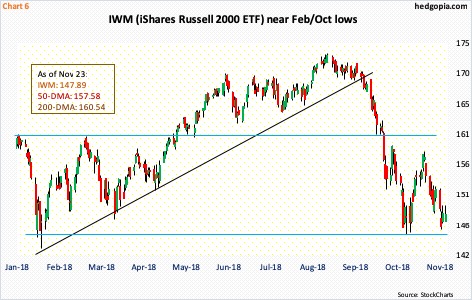
Is this condition sufficient for a rally in stocks near term? Possibly.
For a change, small-caps fared better last week, particularly in the last two sessions. Small-caps are one of the sectors traders tend to gravitate toward as sentiment shifts to risk-on. It may be premature to conclude if this is indeed how things might evolve, but it is prudent to keep an open mind.
IWM (iShares Russell 2000 ETF) last week closed at $147.89 – near the lows of October (Chart 6). The daily chart is oversold. In a bullish scenario, even if a breach occurs, traders could view this as an opportunity to go long in a seasonally favorable period. The October 26th intraday low of $144.70 approximates the daily lower Bollinger band as well as the lows from February this year.
The way IWM/Russell 2000 small cap index came under pressure in October, losing one after another support, resistance is galore. Nearest one lies at $149, and $152 after that. As things stand, it is a win for the bulls if they can force a sideways action near term. Options – short put in this instance – can help position for this scenario.
Hypothetically, IWM November 30th weekly 146.50 puts sell at $1.29. If put, it is a long at $145.21 – pretty close to the recent lows. Else, the premium is kept.
Thanks for reading!
