
Following futures positions of non-commercials are as of March 26, 2019.
10-year note: Currently net short 166.3k, up 2.3k.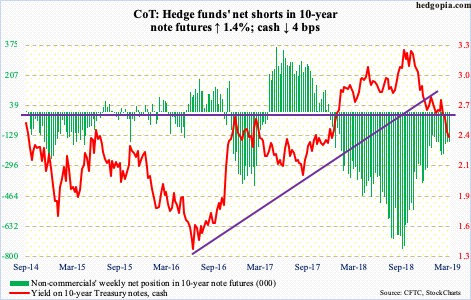
Mid-December last year, the 10-year Treasury rate lost a trend line from July 2016 when it bottomed at 1.34 percent. This was soon followed by a two-month sideways move during which bond bears consistently showed up in defense of 2.62 percent – a crucial level going back a decade. In the middle of this month, this support was gone, which probably took out lots of stops. The 10-year (2.41 percent) quickly fell to Thursday’s intraday low of 2.36 percent. Yields could eventually head toward two percent, but bears (price) have an opportunity to stabilize matters here. Thursday also flashed a spinning top. Support around that session’s low goes back eight-plus years. The daily is way oversold.
30-year bond: Currently net short 18k, down 12.3k.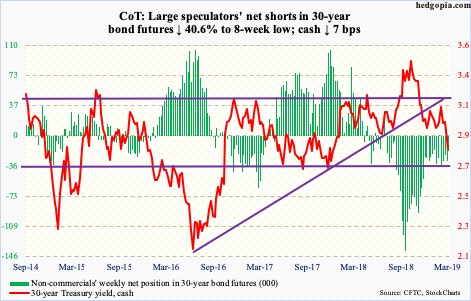
Major economic releases next week are as follows.
Retail sales (February) and ISM manufacturing index (March) are scheduled for Monday.
In January, retail sales increased 2.3 percent year-over-year to a seasonally adjusted annual rate of $504.4 billion. Growth has softened since last July’s 6.6-percent jump. The all-time high of $511.6 billion was reached last October.
Manufacturing activity in February fell 2.4 points month-over-month to 54.2, which was the lowest since November 2016. Last August’s 60.8 was the highest since 61.4 in May 2004.
Tuesday, durable goods orders for February are on tap. January orders for non-defense capital goods ex-aircraft – proxy for business capex plans – rose 4.2 percent y/y to $68.9 billion. As recently as last July, orders rose at an 8.8-percent annual pace.
Wednesday brings March’s ISM non-manufacturing index. Services activity in February rose three points m/m to 59.7.
Jobs data for March are due out Friday. February only produced much-weaker-than-expected 20,000 non-farm jobs. That said, January’s 311,000 was way better than expected.
Crude oil: Currently net long 555.2k, up 25.3k.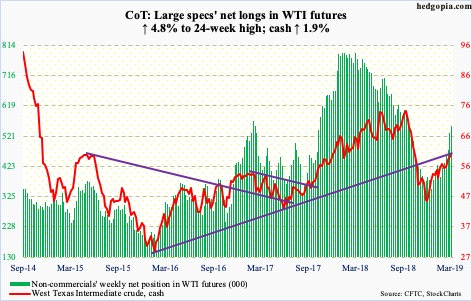
Bulls continued to defend the mini-breakout at $58 from two weeks ago. They at the same time were not able to bust out of $60, toward testing the 200-day moving average ($61.76). During the October-December rout last year, the cash ($60.14/barrel) lost a trend line from February 2016 when the crude bottomed at $26.05. The underside of that trend line gets tested around $62.
The EIA report was mixed. For the week ended March 22, refinery capacity utilization fell 2.3 percentage points to 86.6 percent. Crude stocks rose by 2.8 million barrels to 442.3 million barrels. Crude production was unchanged at 12.1 million barrels per day. Crude imports, on the other hand, fell by 392,000 bpd to 6.5 mbpd. And stocks of both gasoline and distillates dropped by 2.9 million barrels and 2.1 million barrels respectively to 238.6 million barrels and 130.2 million barrels.
E-mini S&P 500: Currently net long 24.1k, up 72.2k.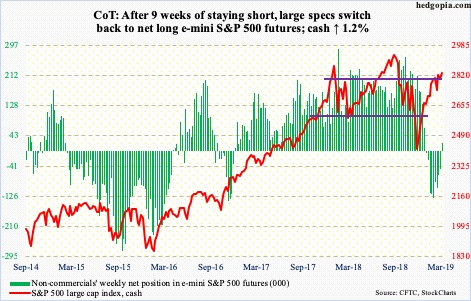
Turns out last week’s positive flows were a one-week wonder. In the week through Wednesday, $11 billion came out of US-based equity funds (courtesy of Lipper). This followed inflows of $3.6 billion last week. Also in the week to Wednesday, SPY (SPDR S&P 500 ETF), VOO (Vanguard S&P 500 ETF) and IVV (iShares core S&P 500 ETF) together lost $2.7 billion, versus inflows of $7.5 billion in the prior week (courtesy of ETF.com). During the same period, $36.5 billion moved into US money-market funds, versus withdrawal of $47.2 billion in the prior week (courtesy of ICI).
Should flows not improve and with the so-called buyback blackout period starting, bulls have their work cut out. Encouragingly for them, non-commercials went net long this week after nine weeks of staying net short.
In the meantime, the cash (2834.4) is on the verge of a 50/200 golden cross – potentially bullish. Although it is important to remember that from Boxing Day to last week’s high of 2860.31, the S&P 500 large cap index rallied nearly 22 percent. For now, bulls and bears continue to fight over control of 2800-plus. It likely gets decided soon who will prevail. The 1Q19 earnings season begins next week in earnest. The sell-side has done its bit. During the quarter, operating earnings estimates for S&P 500 companies were revised lower from $39.66 to $36.92 (courtesy of S&P Dow Jones Indices). This at the same time also raises the odds of a ‘sell the news’. Subtle signs of distribution are there.
Euro: Currently net short 80.3k, up 2.6k.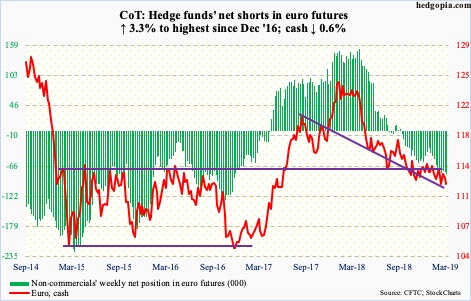
Until a month ago, the ECB planned to raise rates after the summer. Early this month, downgrading eurozone growth forecast to 1.1 percent this year from December’s 1.7 percent, the bank said rates would remain at their present levels at least through the end of 2019. On Wednesday, Mario Draghi, ECB president, suggested the bank could delay a rate hike again.
Rates have been negative for nearly five years now, with the deposit rate at -0.1 percent since June 2014. Not to mention other stimulus measures – both conventional and unconventional. Yet, the eurozone economy is vulnerable – again. If the economy tips into recession, the ECB’s monetary quiver does not have enough arrows, other than to experiment with some more unconventional means.
Draghi’s comments did not help the cash ($112.26), down 0.6 percent for the week. Thursday, a daily spinning top showed up at just north of $112. This is the lower bound of a range the euro has been in for weeks, and needs to hold.
Gold: Currently net long 119.7k, up 31.3k.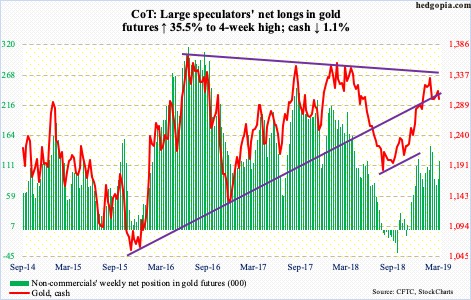
In the week to Wednesday, both GLD (SPDR gold ETF) and IAU (iShares gold trust) saw positive flows – $261 million and $38 million, respectively (courtesy of ETF.com). GLD in particular also gained $491 million in the prior two weeks.
The cash ($1,298.50/ounce) opened the week strong with an intraday high of $1,324.50 on Monday but only to kiss the upper end of a month-long rising channel. In the subsequent sessions, gold not only lost the 50-day but also fell out of the channel. Not to mention slight loss of crucial support at $1,300.
The daily lower Bollinger band lies at $1,280.38, which also approximates the March 7th low of $1,280.80. A failure to hold this level raises the odds that the weekly continues to unwind. The weekly MACD is on the verge of a potentially bearish cross-under, although this is not a scenario non-commercials have in mind. They added in excess of 31k contracts to their net longs this week.
Nasdaq 100 index (mini): Currently net long 7.6k, up 5.4k.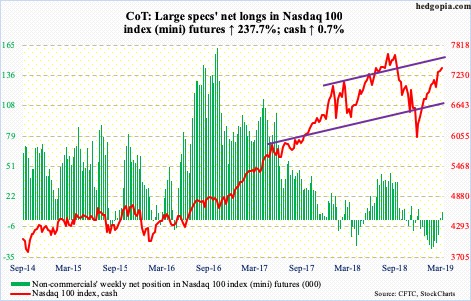
Last week, after rallying in 11 out of 12 weeks, the cash (7378.77) produced a weekly gravestone doji. This week, the Nasdaq 100 rallied 0.7 percent, but this was much weaker than its major US peers. In the event of weakness, horizontal support at 7200, which also approximates trend-line support from late December last year, is crucial.
In the week to Wednesday, QQQ (Invesco QQQ trust) lost $1.5 billion (courtesy of ETF.com). This followed $3 billion in inflows in the prior week, which was the highest weekly total in a year.
Russell 2000 mini-index: Currently net long 559, down 9.3k.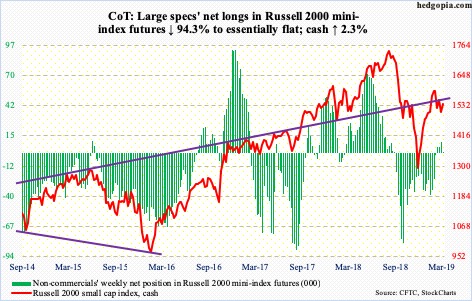
Since getting rejected on February 25 at just north of 1600, the cash (1539.74) has made lower highs. Monday, it also made lower lows, but bulls stepped up to buy that low, thus helping form a descending channel. The upper bound lies at 1550. This is the path of least resistance near term. A breakout opens the door for a test of the 200-day (1577.47), and, of course, 1600-plus. The latter goes back to January last year.
Flows cooperated this week. In the week ended Wednesday, IJR (iShares core S&P small-cap ETF) attracted $20 million and IWM (iShares Russell 2000 ETF) $358 million (courtesy of ETF.com).
US Dollar Index: Currently net long 25.3k, down 650.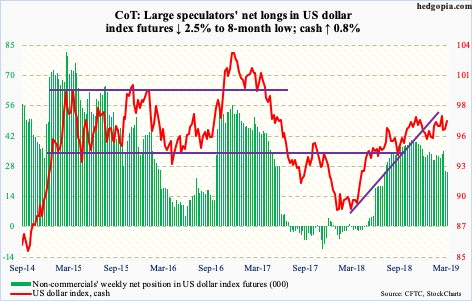
Dollar bulls used last week’s hammer reversal to rally the cash (96.85) 0.7 percent this week. On the daily, there is room for more. The 50-day has been recaptured. In the right circumstances, the daily upper Bollinger band lies at 97.58, which aligns with resistance at 97.50s. Rally attempts have failed at that level several times since last November.
VIX: Currently net short 117.8k, down 10.4k.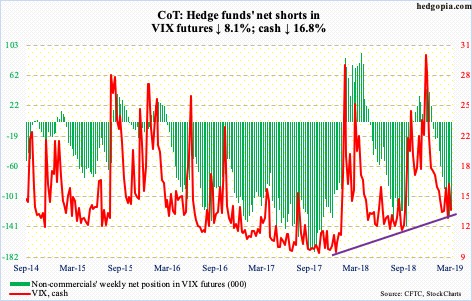
No sooner did volatility bulls retake the 200-day than they lost it. Monday, the cash (13.71) rallied to 17.85 intraday but only to dip below the average by close. VIX has not closed above the 200-day for a couple of months now.
If there is any consolation for bulls, it is that (1) despite the massive rally in stocks post-Christmas, VIX has not gone below 12 for six months now, and (2) the 50-day could be flattening out. If the trend continues, then bulls could be looking at a 50/200 golden cross in a few weeks. This is potentially bullish. Merely two weeks ago, VIX completed a death cross. The index already dropped from 36.20 on Boxing Day to 12.37 nine sessions ago. The odds of a rally are greater than a drop toward 10-11.
Thanks for reading!
