
On the surface, the carnage in stocks last Friday may look like it came out of nowhere, but signs were there.
Up until December 1st, the S&P 500 large cap index was a mere 1.5 percent off the all-time high reached in May this year. That said, the index had been going sideways since February this year (Chart 1). Merely marking time!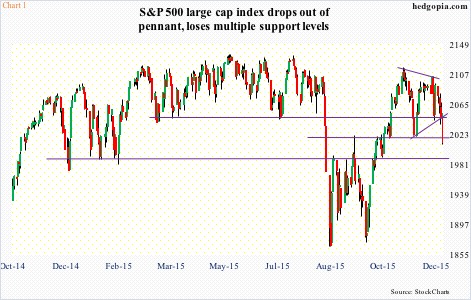
Throughout this, equity inflows were lacking in strength.
Off the September 29th low through November 3rd, the S&P 500 rallied 13 percent. This was a period that only saw inflows of $12 billion into U.S.-based equity funds. Inflows have dropped even further. As of last Wednesday, these funds attracted just a tad over $2 billion. In the meantime, over $37 billion moved into money-market funds in the past three weeks.
Nowhere is this investor apathy more evident than in small-caps. By nature, the Russell 2000 small cap index tends to be more popular when investors are in a risk-on mode.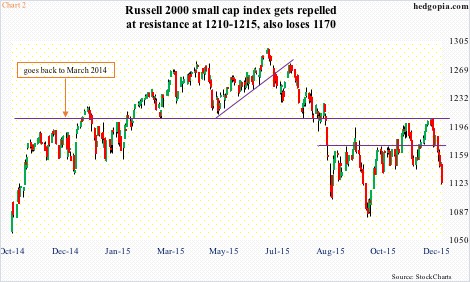
Lethargy set in way too early on the Russell 2000, which peaked in March last year at 1212.82. That high was later surpassed in February this year, but has proven to be an important price point, acting as both resistance and support.
Since it was lost in the August sell-off, the 1210-1215 region is yet to be conquered (Chart 2), even as other large-cap-dominated U.S. indices went on to either score new highs or trade near all-time highs.
Real action has been among large-caps. Even there, an inordinate amount of attention has been thrown at just a few. On the Nasdaq 100, the likes of Apple (AAPL), Microsoft (MSFT), Alphabet (GOOGL), Amazon (AMZN), and Facebook (FB) have garnered the most attention/flows.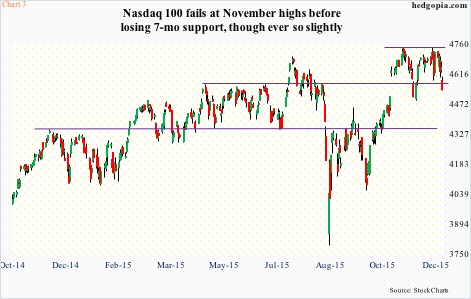
In July this year, the Nasdaq 100 made an all-time high, before substantially coming under pressure in August. The subsequent rally surpassed that July high, peaking in early November. The November high was tested again early this month – unsuccessfully (Chart 3).
Looking at how the Nasdaq 100 fared all this time, it was risk-on alright, but concentrated among just a few names.
On the other side of the spectrum, high-yield corporate bonds were sending an out-and-out risk-off signal. Similar to the message coming out of the small-cap arena.
Chart 4 plots the S&P 500 with JNK, the SPDR high-yield bond ETF. The two have been diverging with each other for a year now, and particularly so the past several months. JNK peaked as early as September last year.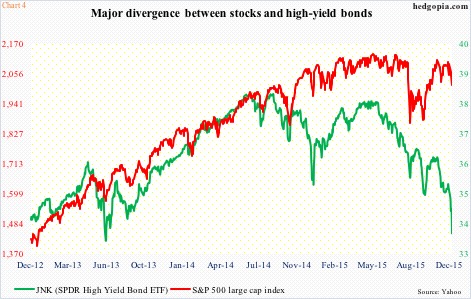
More often than not, credit knows better, and it pays to listen. Once again, credit is leading.
The bigger question is, where to from here?
JNK (33.69) is massively oversold, particularly on a daily basis, and did manage to close one percent off intra-day lows on Friday. There is decent resistance at just under 35.
Simultaneously, major indices are either at or approaching crucial support.
In one fell swoop last week, the S&P 500 (2012.37) lost both 50- and 200-day moving averages as well as support at both 2040 and 2020 (Chart 1). Support at 1990, just one percent away and a must-hold, is probably in play. Bulls’ failure to save this can potentially set in motion a process of unwinding of weekly overbought conditions. In this scenario, more pain lies ahead.
Over on the Nasdaq 100 (4537.56), it just lost 4560, an important level going back to April this year. Last Friday, it lost its 50-day moving average, but the 200-DMA is intact, which is 1.7 percent away. Below that is support going back to November last year (Chart 3).
The Russell 2000 (1123.61) is the weakest link. It was never able to get past March 2014 resistance, lost 1170 support last week, and is two to four percent from August/September lows.
Once again, as is the case with the S&P 500 and the Nasdaq 100, there is plenty of room for weekly overbought conditions to continue to unwind. Hence the significance of the afore-mentioned support particularly on the S&P 500 and the Nasdaq 100.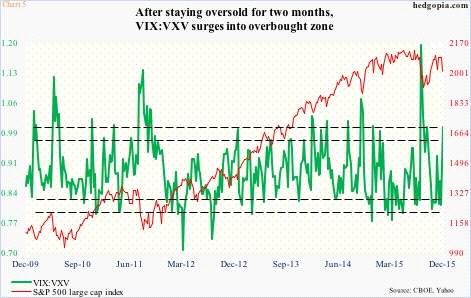
Should equity bulls put their foot down, given favorable seasonality and Chart 5 for instance, a rally can ensue, duration notwithstanding.
The VIX:VXV ratio in the chart above just entered overbought zone. It can always shoot higher, as happened in August, but once it begins to come under pressure from overbought levels, stocks can rise. Thus far, that has yet to happen.
Thanks for reading!
