
The magnitude of the equity rally the past couple of months has surprised many.
Off the February 11th low through Thursday’s high, the S&P 500 index rallied 15 percent.
This, despite the fact that equity flows into U.S.-based funds have been negative since the rally got underway. From the week ended February 10th through Wednesday, $12.1 billion left these funds (courtesy of Lipper).
Shorts lent a big hand, though.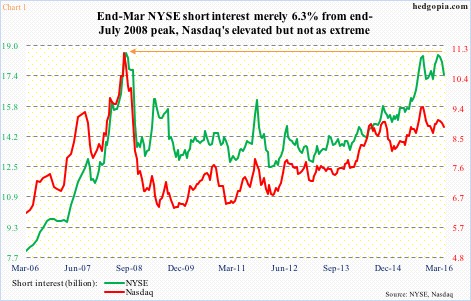
On the NYSE composite, short interest dropped from 18.51 billion on February 12th to 17.44 billion on March 31st. On the Nasdaq composite, it went from 9.08 billion to 8.89 billion. This is a drop of 5.8 percent and 2.4 percent, in that order (Chart 1).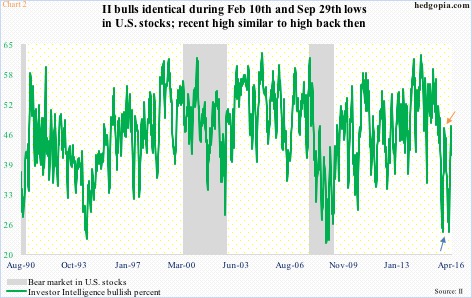
Two months ago when stocks were trying to hammer out a bottom, investor mood was acutely sour.
As of February 10th, a mere 24.7 percent of Investors Intelligence survey respondents were bullish. Post-August/September sell-off last year, that is how far down bulls dropped before equities bottomed (blue arrow in Chart 2).
Two months later, bulls are now in the low 40 percent, having peaked at 47.4 percent on March 23rd. Once again, this was similar to the 46.9-percent November 3rd reading that marked a high post-September 30th rally (orange arrow in Chart 2).
One look at Chart 2, and one thing becomes abundantly clear – there is plenty of room for the green line to continue higher. In the right circumstances, that is.
Other investor surveys indicate the same.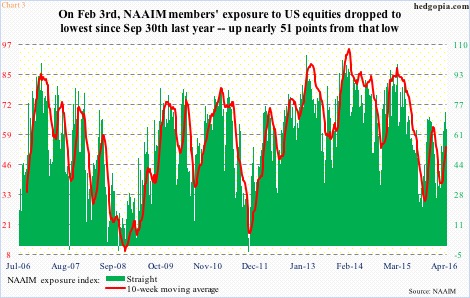
As of February 3rd, members of the National Association of Active Investment Managers had 22.4 percent equity exposure – the lowest since 16.4 percent on September 30th. By April 6th, this rose to 73.2 percent, before dropping to 64 percent in the latest week (Chart 3). Both the red line and green bars have room to move higher before reaching frothy zone.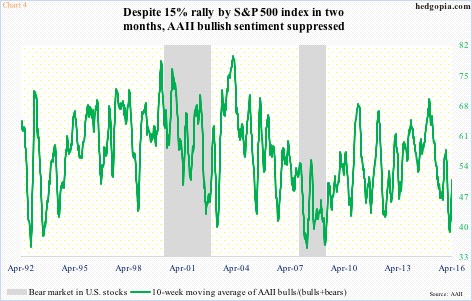
Or take a look at the American Association of Individual Investors survey. Bulls were a mere 27.8 percent in the latest week. On February 11th, this had dropped to 19.2 percent. Even the March 10th high of 37.4 percent pales in comparison to past peaks (Chart 4).
At least in theory, all these surveys have room to move higher.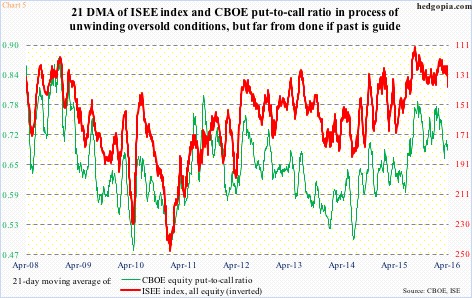
As does Chart 5, which plots the 21-day moving average of the CBOE put-to-call ratio and the ISEE index (all equity). The latter is a call-to-put ratio, hence inverted. Both have been unwinding the extreme investor caution seen during the August-September sell-off last year followed by another one in January this year. If they were to try to get to levels that in the past marked major peaks in equities, there is room for continued unwinding.
That is exactly the scenario the bulls are hoping for – a perfect storm in which more and more jump on the bullish bandwagon (Charts 2, 3, 4 and 5), ultimately squeezing the shorts (Chart 1).
But at this stage in the cycle, that may be asking for a tad too much.
Thanks for reading!
