
To say that stocks have diverged from a whole host of things ranging from earnings to Treasury bonds to crude oil to economic data is an understatement.
This is not some new phenomenon … has been going on for a while.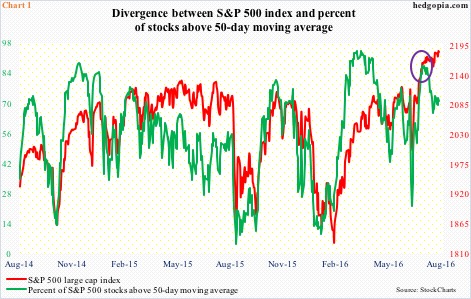
Last week, all three major U.S. indices reached new intra-day highs – 2188.45 on the S&P 500 large cap index, 18638.34 on the Dow Industrials and 5238.54 on the Nasdaq composite. This took place even as signs of divergence among internals are cropping up.
The S&P 500 (2184.05) broke past the May 2015 all-time high on July 11th. Three sessions later, the index began to go sideways. The percent of S&P 500 stocks above 50-day moving average peaked on July 11th as well. Since then, the red line in Chart 1 is higher by 20 points, but the green line is lower by 16.4 percentage points, to 71 percent. The divergence is denoted by the violet circle in the chart.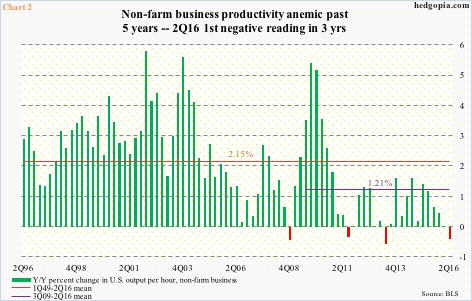
Two of the economic data out last week were productivity and retail sales. Both disappointed. The former in particular has been sub-par for a while now. Going all the way back to 1Q49, output per hour has grown at an average 2.15 percent year-over-year. Post-Great Recession, this decelerated to 1.21 percent; even this growth was heavily skewed by above-average 3Q09-3Q10. After that early spurt, only six quarters have averaged growth of over 1.21 percent, with 2Q16 going negative. This was the first negative quarter since 2Q13 (Chart 2).
Economic growth is determined by population growth and productivity of that population. Decline in productivity means growth is supported by output. With the unemployment rate at sub-five percent, the prevailing trend in productivity is bound to impact growth numbers … in fact, it already has. One major way in which productivity is enhanced is through investments in capital stock. The news is sanguine on this front.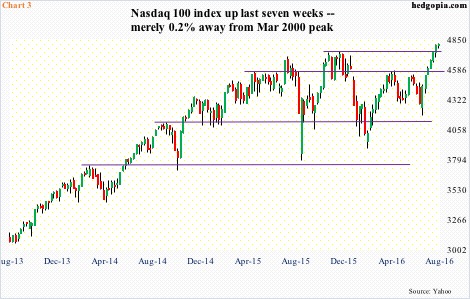
Capital expenditures have been subdued throughout this cycle. In the last three quarters, non-residential fixed investment subtracted from real GDP growth. Investments in intellectual property products were holding up – relatively – but contribution from equipment investments was negative in four out of the last five quarters.
Capex fundamentals are downright gloomy. But technicals are pointing otherwise.
The Nasdaq composite last week notched a new all-time high of 5238.54. The Nasdaq 100 (4807.08) came within three points of surpassing its March 2000 all-time high. Post-Brexit, the latter has rallied for seven straight weeks, breaking out of at least a couple of major resistance levels (Chart 3). Price is the final arbiter, but stocks for now have diverged from fundamentals.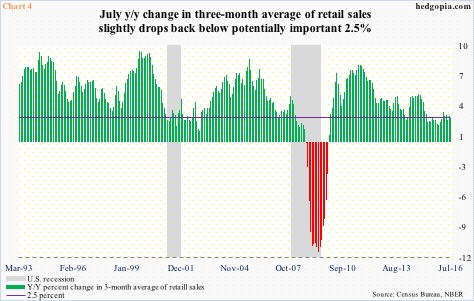
July’s retail sales were also reported last week, dropping 0.04 percent month-over-month to a seasonally adjusted annual rate of $457.7 billion. This was the first monthly drop in four months. Results were weaker than expected. Annual growth has decelerated from 3.62 percent in February this year to 2.26 percent.
Chart 4 calculates year-over-year growth in three-month average of retail sales. July decelerated to 2.47 percent from 2.7 percent m/m. The latest deceleration began in February this year. Consumers are the linchpin of the U.S. economy, particularly this cycle, so they cannot afford to slow down; 3Q16 has not started out well.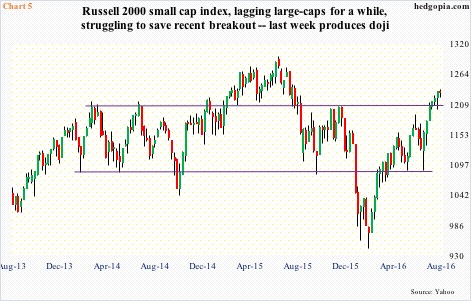
Small-caps inherently tend to have sole/heavy exposure to the domestic economy. The Russell 2000 small-cap index broke out of two-plus-year resistance three weeks ago (Chart 5). Unlike other major U.S. indices, it has not yet scored a new all-time high. That said, the 31-percent rally since February this year, and particularly since post-Brexit lows, should imply good things for the economy. If these stocks are discounting the future, that is. Unless other factors are helping it diverge from fundamentals. 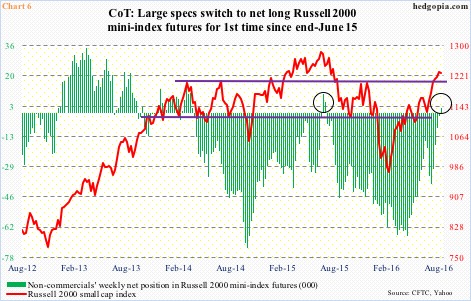
Shorts have gotten squeezed. Since the end of June, short interest on IWM, the iShares Russell 2000 ETF, dropped 15-plus percent to 97.6 million. In the futures market, as early as the middle of April, non-commercials’ net shorts in Russell 2000 mini-index futures totaled 66,871 contracts, which gradually decreased as these traders began to cover. This was a big tailwind for the Russell 2000. In the latest week, they switched to net long – the first time since June last year (Chart 6).
Here is the rub. A lot of buying power has been expended already in pushing the Russell 2000 to this point. Since June 27th through last Wednesday, IWM attracted $1.3 billion (courtesy of ETF.com). With the kind of rally it has had over the last several weeks, the Russell 2000 is beginning to show signs of fatigue, with a doji last week (Chart 5). Odds favor the green bars in Chart 6 meet the same fate as did a year ago. The switch back then to net longs pretty much coincided with the peak in the Russell 2000.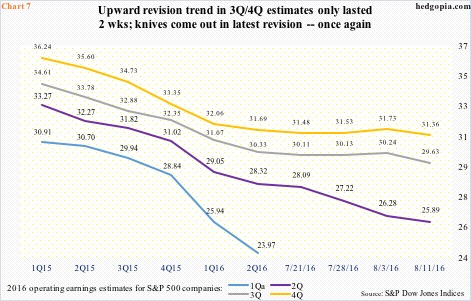
Speaking of divergence, earnings are front and center. With 455 of S&P 500 companies having reported 2Q16 (as of August 11th), 319 beat on operating earnings, 96 missed, and 40 met. The 70.1-percent beat ratio looks decent, until we realize this. Since the quarter closed less than six weeks ago, estimates have been slashed by $2.43 to $25.89; in 1Q15, the quarter was expected to earn $33.27! Until recently, estimates for both 3Q and 4Q this year were on downward trajectory as well, although the slope was not as steep as 2Q. Then, both began to hook up in recent weeks. This was cut short in the latest revision, with both revised downward to a new low.
This is yet to adversely impact stocks. But, once again, signs of fatigue/indecision are showing up. A weekly doji showed up on the S&P 500 last week. This comes on the heels of back-to-back weekly hanging man candles.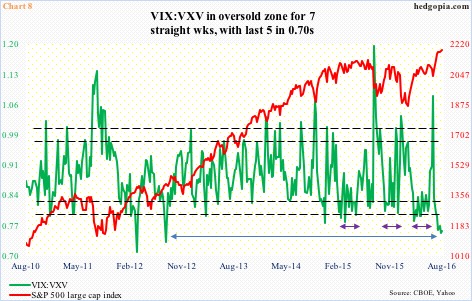
The VIX-to-VXV ratio continues to languish in oversold territory. Five of the last seven weeks were in mid- to high-0.70s and two in low-0.80s (Chart 8). Non-commercials have built 118,817 contracts in net shorts in VIX futures – the highest ever. And spot VIX is at the bottom end of a multi-year range, with a weekly doji last week – a sign of burnout.
Mean-reversion odds have grown. With that the odds of divergences to end – at lease some.
Thanks for reading!
