
Price is the final arbiter … is an often-quoted axiom in finance. Has truth in it. For a trend to establish itself, price has to cooperate. As long as this continues, there is no use fighting it. Of course, all the better if along with the price signal, other signals – or most – are conveying the same message.
Post-Trump victory, U.S. stocks have done very well. For the most part, anyway. Some like financials have done extremely well, some not. XLF, the SPDR financial ETF, rallied north of 12 percent since the election, while XLU, the SPDR utilities ETF, has lost 4.5 percent.
This is all part of investing. Markets believe financials stand to benefit from potentially less regulation (less restrictive Dodd-Frank) and a steep Treasury yield curve. XLU, on the other hand, was previously treated as a bond proxy, and once interest rates rose, money left. All part of rotation.
At the same time, since election results were known, several instances of divergence – not that easy to explain – have come up. Of the various dominating themes post-Trump victory, three jump out – strength in the U.S. dollar as well as small-caps, and relative weakness in tech.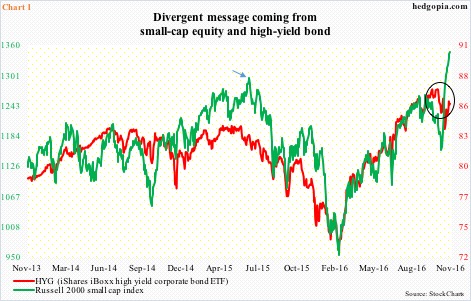
Take small-caps, for instance.
Going into the election, of major U.S. indices, the Russell 2000 small cap index was a laggard. It was still trading under the June 2015 high (arrow in Chart 1), even as its peers had rallied to new highs. November 8 change that.
President-elect Trump plans to cut taxes, invest in infrastructure, and cut regulations, among others. Markets currently are near unanimous in the belief that all this is going to boost growth. Small-caps inherently are domestically focused. Hence trader/investor interest.
From November 3 through last Friday, the Russell 2000 (1347.2) jumped 16.5 percent, rallying for 15 consecutive sessions! Since November 8 (election), it has rallied 12.7 percent.
Here is the rub. Since the election, HYG, the iShares iBoxx high-yield corporate bond ETF, has dropped 0.3 percent. One would think small-caps and high-yield debt would move in tandem if the economy was expected to shift into high gear. Notice the divergence in Chart 1 (circle).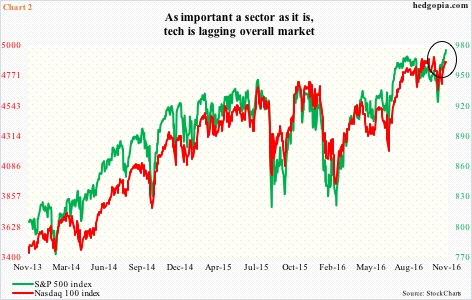
Chart 2 is the same way. It plots the S&P 100 index with the Nasdaq 100 index. Both are large-caps, but in a risk-on environment, the latter tends to outperform, but not this time. Post-election, the former has rallied 2.9 percent, and the latter 1.3 percent.
In fact, the S&P 100 has proceeded to rally to a new all-time high. The Nasdaq 100 is still under its all-time high of 4911.76 reached on October 25 (Chart 2).
Tech is not just any other sector. As of 3Q16, information technology had a weighting of north of 21 percent within the S&P 500. In the current quarter, it is expected to contribute 25 percent of S&P 500 operating earnings. For whatever reason it is lagging, stocks cannot continue marching higher without the sector participating. The price action, however, suggests otherwise.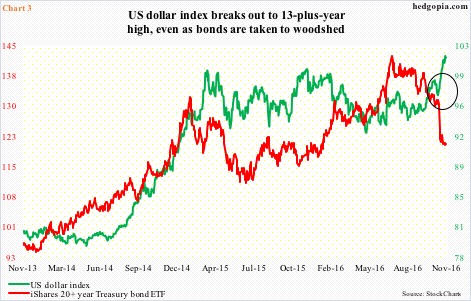
Speaking of price action, the US dollar index has rallied to a 13-plus-year high. After rallying 25-plus percent in nine months, the index peaked in March last year at 100.71. Later in November, that level was tested again – unsuccessfully.
This time around, the dollar index had already been rallying since May this year. The Trump victory gave it an additional boost – past the horizontal resistance from March last year. It is rising on the coattails of interest rates, which have backed up quite a bit, although from suppressed levels.
The two-year Treasury yield – most sensitive to the Fed’s monetary policy – has rallied from 0.87 percent on November 8 (0.80 on November 4) to 1.12 percent last Friday. This is the highest since 1.18 percent in April 2010.
The problem is, a strong dollar is stealth tightening. The Fed may even voice its concerns, come December 13-14, when it is expected to raise rates.
Dollar strength eventually will get reflected – adversely – in U.S. exports, corporate earnings, and what have you. Pretty soon, this then begins to get reflected in the yield curve on the long end. And the curve no longer steepens.
Currently, the dollar index is diverging with TLT, the iShares 20+ year Treasury bond ETF (Chart 3). One of the two is lying.
The same way either small-cap equity is lying or high-yield corporate bond is lying. Or either the Nasdaq 100 will join the S&P 100, or the hitherto leader joins the laggard.
The signal from price is not uniform. At a time like this, it is always prudent to have one foot out the door.
Thanks for reading!
