
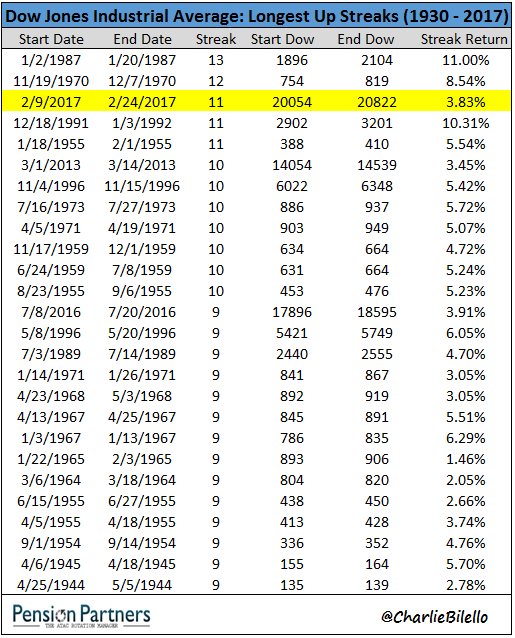
The Dow Industrials is on pace to creating history this week. Last Friday, it rose for 11 sessions in a row, for a cumulative gain of 3.8 percent. The longest streak was recorded in January 1987 when it rallied 11 percent in 13 sessions. The second longest was 12 in November-December 1970 for 8.5 percent (courtesy of Charlie Bilello of Pension Partners).
There have been two other instances in which the Dow rose for 11 straight sessions – 1/18/1955 to 2/1/1955 (5.5 percent) and 12/18/1991 to 1/3/1992 (10.3 percent).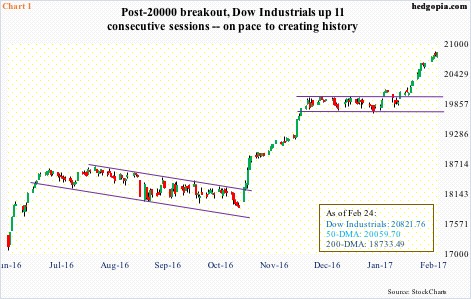
The Dow is already up 5.7 percent year-to-date (Chart 1). Large-caps are in favor this year. The S&P 500 large cap index has rallied 5.7 percent, and the Nasdaq composite 8.6 percent. Even within tech, the Nasdaq 100 index is up 9.9 percent. Contrast this with the Russell 2000 small cap index which is up 2.8 percent.
Post-November 8 election last year, these indices respectively rallied 13.6 percent (Dow), 10.6 percent (S&P 500), 12.6 percent (Nasdaq), 11.2 percent (Nasdaq 100) and 16.7 percent (Russell 2000).
Are they extended enough, particularly the Dow since it is the one going for the record books?
Simplistically, from the perspective of the number of sessions it has rallied, the Dow is beyond extended, but not from the viewpoint of percentage gains. As noted above, it rallied 3.8 percent in the last 11 sessions.
More importantly, are there ingredients in place for continuation of this rally or are they stretched as well?
The last time the Dow rallied for 11 sessions in a row was back in December 1991/January 1992. We can use this as a reference point and see how things compare – then versus now.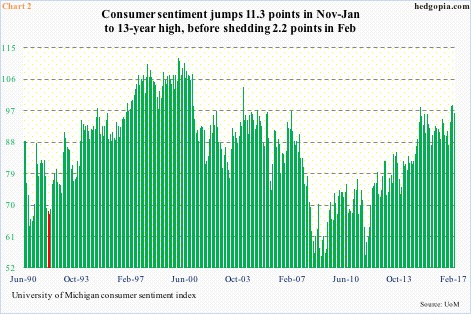
Chart 2 plots the University of Michigan’s consumer sentiment index going back to 1990. On the left are two red bars, which correspond to December 1991 and January 1992 – 68.2 and 67.5, respectively – with room to run. And it did run, ultimately peaking at 112 in January 2000.
This time around, the last time sentiment was in the ‘60s was late 2011. Post-election, it surged 11.3 points in three months to January’s 13-year high 98.5. February was down 2.2 points. As elevated as the green bars are, if anything, they can weaken from here.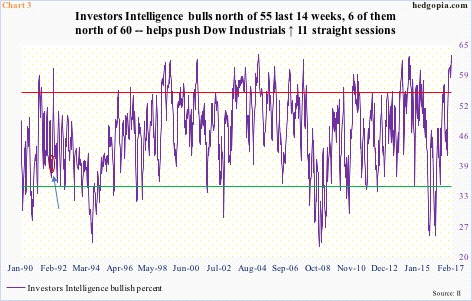
Investor sentiment is the same way.
In the three weeks ended January 3, 1992, Investors Intelligence bulls were 38.4, 42.1 and 45.6 (burgundy oval in Chart 3), reaching 60 in the next couple of weeks. As is seen in the chart, sentiment was hardly effusive back then, exactly the opposite of what we have now.
Bulls bottomed at 24.7 in the week ended February 10 last year. Stocks bottomed on the 11th. Particularly after last year’s election, sentiment went parabolic. In the week ended November 15, bulls jumped 8.1 points week-over-week to 51. In the following 14 weeks, they persistently remained above 55 – and six out of them north of 60, including the last four. These are rare readings … the path of least resistance is probably down, not up.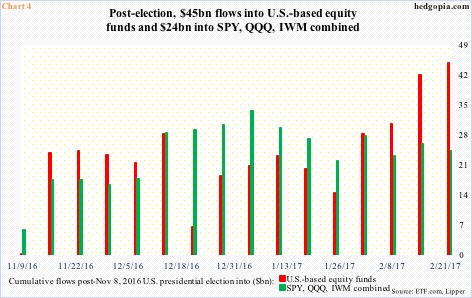
The elevated readings in both Charts 2 and 3 are reflected in flows – sort of putting money where mouth is.
Lipper data show that since the election a whopping $44.8 billion moved into U.S.-based equity funds. Another $24.3 billion went into three leading ETFs – SPY (SPDR S&P 500 ETF), QQQ (PowerShares Nasdaq 100 ETF), and IWM (iShares Russell 2000 ETF). (Flows are as of last Wednesday.)
That is a lot of buying power. Nothing says this cannot continue. But this is a finite source.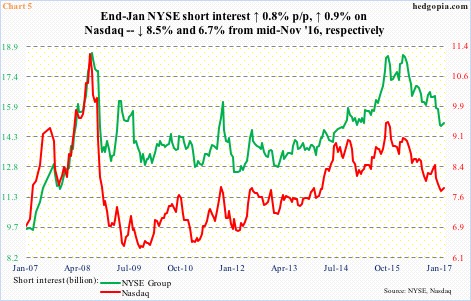
As is short squeeze.
By mid-February last year, NYSE short interest had jumped to 18.5 billion, nearly matching the end-July 2008 all-time high of 18.6 billion. On the Nasdaq, mid-February 2016 short interest was 9.1 billion, having already peaked at 9.5 billion at the end of September 2015, which marked another important low in stocks.
Since February last year, NYSE short interest tumbled 18.9 percent, and on the Nasdaq 13.7 percent. Post-election, they are respectively down 8.5 percent and 6.7 percent. This has been a big tailwind for stocks. But with each decrease in short interest brings lessened odds of a squeeze.
This logic also applies to Charts 2, 3 and 4. Inflows are not an infinite source, for example.
The point in all this is that the Dow may or may not make history this week, but necessary ingredients for continuation of the ongoing rally are missing, and severely stretched themselves.
Thanks for reading!
