
- Economy was probably not reason why QE2/3 got launched, stock sell-off was
- One month after QE1/2 ended, stocks began to act sick, prompting Fed into action
- Year-end rally may or may not happen; impending sell-off to test Fed’s pain threshold
QE3 has come to an end. Thankfully. Going by the prior two iterations since the financial crisis, that could portend bad days ahead for stocks. As shown below, in both 2010 and 2011 as QE ended and the Fed’s balance sheet went sideways, stocks wobbled. As the saying goes, history does not repeat itself, but it does rhyme.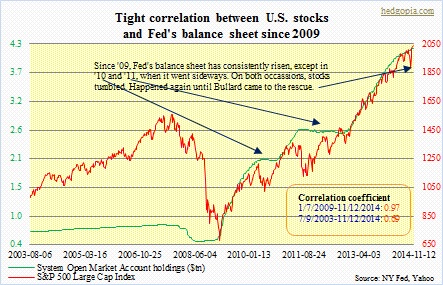
But ‘it is different this time’. Bulls would argue, and they have data points to back up their optimism. Despite weakness pretty much across the rest of the globe, the U.S. economy is doing just fine, and firming up. Corporate profits are strong. Valuations are not at nose-bleed territory. And by selling, where else would you put your money? All valid points.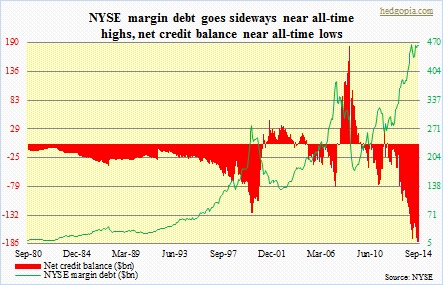
Bears claim, ‘it is coming, stocks will take a hit – just a matter of time’. They point out how they have remained levitated thanks to the liquidity provided by the Fed. U.S. stocks have not had a 10-percent correction for well over two years. This past September/October, the S&P 500 index came very close – down 9.8 percent intra-day – but James Bullard came to the rescue right on time, telling Bloomberg TV the Fed should consider delay in ending QE. The so-called Fed put has encouraged investors to get on the risk curve and lever up. Elevated margin debt is just an example.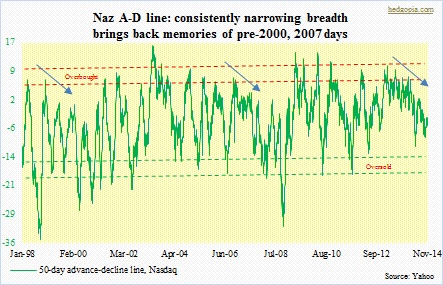
What at the beginning was termed ‘Bullard bounce’ has proven to be more than a bounce. The S&P 500 notched another high yesterday before backing off slightly – 43rd this year, second only to last year’s all-time record of 45 new highs. Off the October 15th intra-day low of 1821 to the intra-day high yesterday, the S&P 500 has rallied nearly 13 percent. That is in 25 sessions. Seriously, a mere 25 sessions! Makes one wonder how sustainable all this is.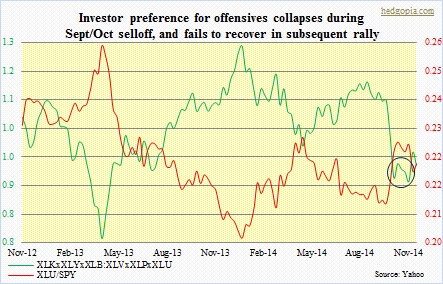
For a non-believer, there is no shortage of things to nitpick. The rally has been led by defensive sectors. In fact, that has been the case in all of 2014. Most recently, offensive sectors (XLK, XLY and XLB) began to lag their defensive counterparts (XLV, XLP and XLU) mid-August, a month ahead of the start of broad selling. As stocks bottomed mid-October and surged, defensives continued to be in demand (circle in chart above). There is also lousy participation. The advance-decline line is horrible – particularly on the Nasdaq (third chart above). Big-caps are leading, with plenty of weakness under the surface.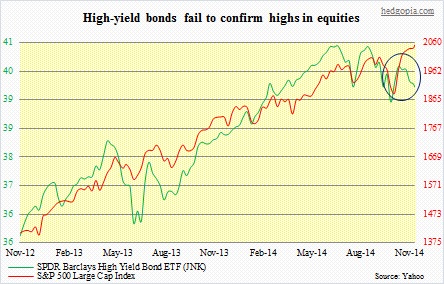
There is a similar message coming out of the credit market. If stocks are rallying solely on the back of corporate health, then junk bonds should be riding on their coattails. As stocks began to fall apart toward the middle of September, junk bonds followed suit. So far so good. However, as the former found a trough mid-October the latter followed suit for a brief period and then decoupled. Financials are doing the same, rallying even as the 10-2 yield spread continues to narrow.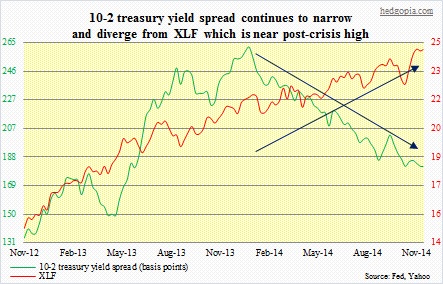
There are many more other divergences. The point is, stocks are rallying, but not everything is in sync. Yes, when it is all said and done, price trumps everything, and that has been the case for a while now. But this has also come at a time of extraordinary Fed liquidity. And that is now gone. Hence the question, will it be really different this time?
|
Starts |
Ends |
As QE ends |
Post-QE |
Post-QE, S&P 500 change in |
|||||
| Fed funds, effective | 10-year yield | Real GDP | Real GDP | one month | three months | six months | |||
| QE1 | 11/25/08 | 3/31/10 | 0.09 | 3.84 | 1.7 (1Q10) | 3.9 (2Q10) | 1.5% | -11.9% | -2.4% |
| QE2 | 11/3/10 | 6/30/11 | 0.07 | 3.18 | 2.9 (2Q11) | 0.8 (3Q11) | -2.1% | -14.3% | -4.8% |
| QE3 | 9/13/12 | 10/31/14* | 0.07 | 2.35 | 3.5 (3Q14) | 3.0^ (4Q14) | 1.7%~ |
? |
? |
*tapering begins on 12/18/13…^consensus…~as of November 18, 2014
The table above tallies how some metrics looked during and after QE1 and QE2 and, importantly, how stocks fared. One thing is clear. The economy was not the reason why QE2 was initiated. QE1 ended in March 2010. Real GDP grew 1.7 percent in 1Q10, followed by growth of 3.9 percent in 2Q and 2.7 percent in 3Q. QE2 got launched in November 2010 anyway. The difference? Stocks tumbled – down 12 percent by the end of June that year. The following year, the pattern repeats itself. Real GDP did decelerate to 0.8 percent growth in 3Q11 but picked back up to 4.6 percent growth in 4Q. Until QE3 was launched in September 2012, GDP growth was 2.3 percent in 1Q12 and 1.6 percent in 2Q12 (and 2.5 percent in 3Q12). Once again, in the wake of the end of QE2, stocks took a hit – down 14 percent by September 2011. And that is what moved the Fed.
The Bernanke Fed was a firm believer in the wealth effect, and indications are that the Yellen Fed is no different. In the midst of a sell-off, James Bullard on October 16 came on Bloomberg TV for a reason. The bigger question is, what is the threshold before the Fed feels compelled to intervene – stocks down 10 percent, 15 percent, or higher? We will find out. A selloff is coming. Seasonality may delay it – or not. Inflows into equity funds have surged the past few weeks – all positioned for a sucker to come and buy from them. But given how stocks behaved one month after QE1/2 ended, it is dangerous to be chasing a year-end rally that may or may not come this year.
