
Stocks increasingly are beginning to price in a possible democratic sweep on November 3. Both small- and large-caps staged important technical breakouts last week. They are liking the prospect of more stimulus, that is rising budget deficit. If this scenario pans out, comes a time when markets will begin to worry about a tax hike.
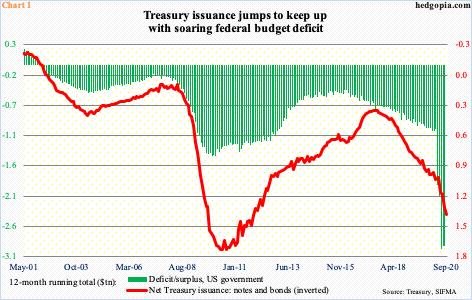
Stocks are cheering on the prospect of a higher budget deficit, which is already bulging at the seams.
Markets are hungry for more fiscal stimulus. Even as the White House and Congress fail to seal a deal, the prospect of a Joe Biden victory on November 3 has been interpreted as bullish, as this could mean more stimulus. For this scenario to come to pass, the Senate too needs to go to the Democrats. Should that happen, then, pretty soon, markets will begin to worry about a tax hike.
But markets do not want to entertain that thought right now, only that a Biden victory can bring more stimulus money.
Besides, the budget deficit already is at a three-trillion range. In the 12 months to August, the red ink was $2.92 trillion, having hit a record $2.98 trillion in June (Chart 1). Issuance of Treasury notes and bonds accordingly has jumped, which reached $1.36 trillion on a 12-month basis in September.
More fiscal help could also mean the economy continues to recover, and the massive jump in earnings estimated for next year comes true. At least that is how equity bulls are viewing things currently.
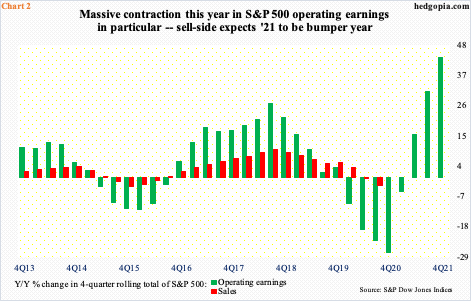
As of last Thursday, operating earnings for S&P 500 companies this year were expected to come in at $114.25, versus $157.12 earned last year. As things stand, the year-over-year change in both earnings and sales has gone negative. This is expected to hugely improve next year, with the sell-side having penciled in a 43.5-percent jump in earnings next year, to $163.93 (Chart 2).
The 3Q20 earnings season begins this week, with financials customarily getting the ball rolling. Ahead of this, S&P 500 companies are expected to ring up $32.44, which is down substantially from $48.13 expected in March last year but the revision trend has improved recently, with $30.89 expected at the start of the quarter.
Accordingly, estimates for this year bottomed at $108.86 early July and for next year at $160.89 in the middle of that month.
As Biden’s prospects improved in the polls, investors have gravitated toward small-caps, which inherently have larger exposure to the domestic economy versus large-caps. Traditionally, small-caps are used as a vehicle to bet on the economy. These stocks have gone gangbusters the last two weeks.
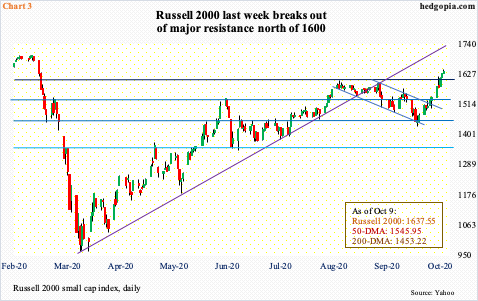
On September 24, the Russell 2000 breached horizontal support at 1450s-60s tagging 1432.57 intraday. Earlier on August 11, the small cap index was rejected at 1600-plus. The 10.7-percent drop also brought the index to its 200-day. In fact, on September 24 – a long-legged doji session – the average was breached, albeit slightly. But small-cap bulls used that as an opportunity to step up. From that low through last Friday’s high, the index (1637.55) jumped 14.8 percent.
In the process, the Russell 2000 last week broke out of major resistance. Going back to January 2018, 1600-plus has proven to be an important price point. As previously mentioned, an attempt to break out was rejected two months ago (Chart 3). But the ceiling gave way last week. The all-time high of 1742.09 from August 2018 is 6.4 percent away. Last week, the index rallied by precisely that amount.
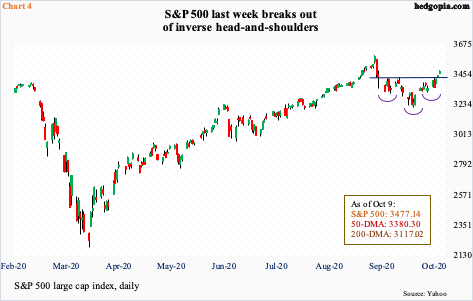
The S&P 500, too, bottomed on September 24. From the 2nd that month, the large cap index lost 10.6 percent, before bulls defended straight-line support at 3220s-3230s. Soon, the 50-day (3380.30) was reclaimed. This was followed last week by the recapturing of 3390s, which is where the index peaked in February – just before the February-March collapse. There is also a 10/20 crossover now.
Last week, bulls scored another victory, breaking out of one-month inverse head-and-shoulders. The neckline was broken at 3420s. If the breakout is genuine, the technically oriented ones would be eyeing north of 3600. The S&P 500 (3477.14) peaked at 3588.11 on September 2.
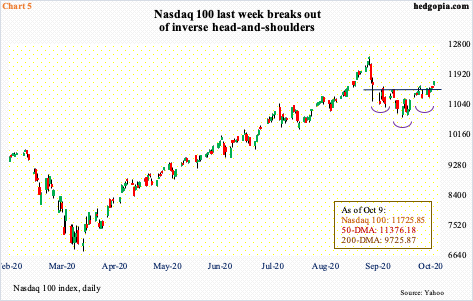
The Nasdaq 100 experienced a similar breakout last week. The index peaked on September 2 at 12439.48, up 83.7 percent from the March 23rd low. From that peak through September 21, it then dropped 14.2 percent. The 50-day was compromised by then. The index remained underneath the average for seven sessions before tech bulls reclaimed it two weeks ago.
For a month now, rally attempts were getting stopped at 11500-11600. In due course, this also made up the neckline of an inverse head-and-shoulders formation. This was taken care of later last week (Chart 5). If the breakout acts as a self-fulfilling prophecy, the index (11725.85) has room to rally toward the September 2nd high.
The Nasdaq 100 is 6.1 percent from its all-time high, which is not a whole lot in the big scheme of things. Last week alone, the index rallied 4.2 percent.
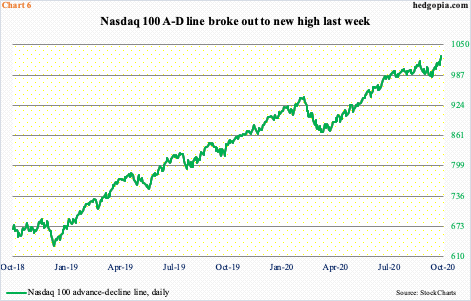
In the meantime, the Nasdaq 100 advance-decline line broke out to a new high last week (Chart 6). The metric has diverged from the index; it is possible the latter follows the former higher.
Last week, the A-D line also made a new high on the S&P 500 as well as on the NYSE composite. The NYSE common-stock-only A-D line, however, is yet to do so.
The advance-decline line is important since it calculates the difference between the number of advancing and declining stocks. It is a way to find out if more stocks are rising or falling at any given time. Currently, more are rallying.
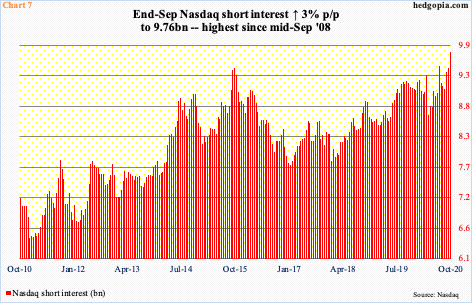
Ahead of this, Nasdaq shorts were betting that tech bulls would be unable to meaningfully build on the reclaiming of the 50-day in the latter sessions of September. But, as previously mentioned, the index just staged a head-and-shoulders breakout.
It is possible this already caused some short-covering. At the end of September, Nasdaq short interest increased three percent period-over-period to 9.76 billion, which is the highest since mid-September 2008. This is as good an opportunity as it can get for bulls to try to squeeze.
Beginning next week, tech will begin to report 3Q results. The bar is low. Bulls have improving technicals on their side, and it can feed on itself, particularly so if Biden continues to widen his lead – enough to knock back risks of a contested election. All this until markets begin to worry about a possible tax hike.
Thanks for reading!
