
Last week, equity bulls owned the first two sessions, but only for bears to make a strong comeback as the week progressed, forming potentially bearish candles along the way. Right here and now, the bias is down.
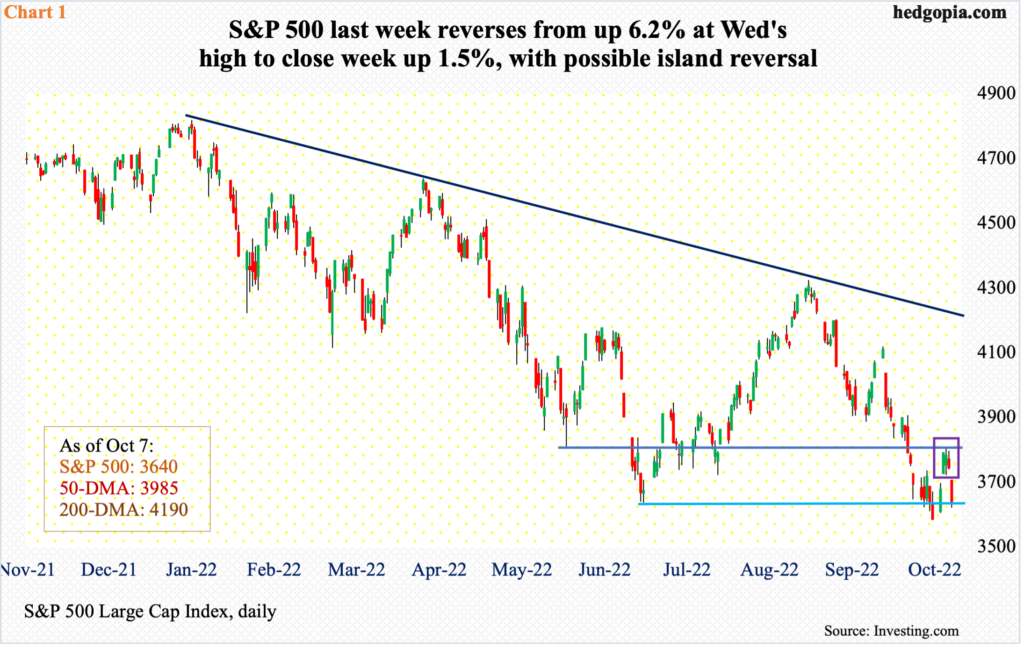
The two-day rally last Monday and Tuesday did not last very long. Through Wednesday’s intraday high of 3807, the S&P 500 was up 6.2 percent. And then the sellers came out in droves. There was horizontal resistance at 3810s and that was just about tagged on Wednesday, drawing offers. By the end of the week, the gains were reduced to merely 1.5 percent.
In the process, the intra-week reversal helped form a weekly shooting star. Tuesday’s gap-up and Friday’s gap-down also resulted in an island reversal (box in Chart 1). The large cap index closed out the week at 3640, essentially matching the June low of 3637.
Flows are not cooperating at all. In the week to Wednesday, $4.5 billion left US equity funds (courtesy of Lipper). This was the seventh consecutive weekly outflows, during which $56 billion was redeemed.
As things stand, risks are rising the September 30 low of 3580s gets breached in the sessions ahead.
The Nasdaq 100 is the same way.
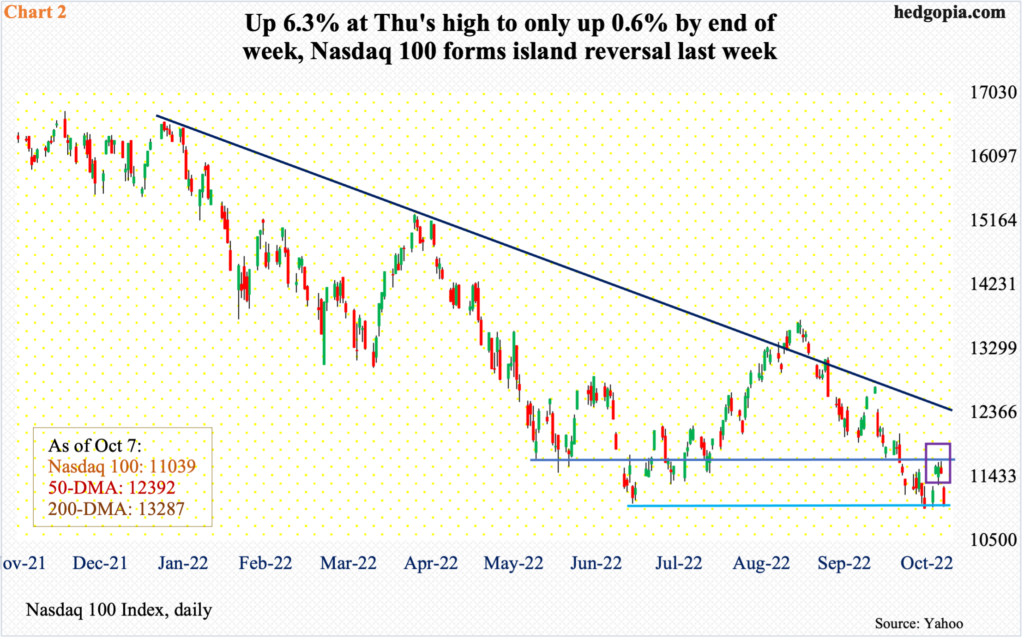
Through Thursday’s intraday high of 11661, the tech-heavy index was up 6.3 percent for the week. There was lateral resistance at 11700s, which was used as an opportunity to lighten up/go short. When everything was said and done, the index reversed to end up only 0.6 percent.
A gravestone doji showed up on the weekly. As well, as was the case with the S&P 500, the Nasdaq 100 too formed an island reversal (box in Chart 2), closing the week at 11039, essentially matching the June 16 low of 11037. The September 30 low of 10967 slightly undercut that low, but barely. Odds favor a breach happens in the sessions ahead.
Right here and now, bears are probably eyeing 10589, which is a 61.8-percent Fibonacci retracement of the surge from March 2020 to last November’s record high.
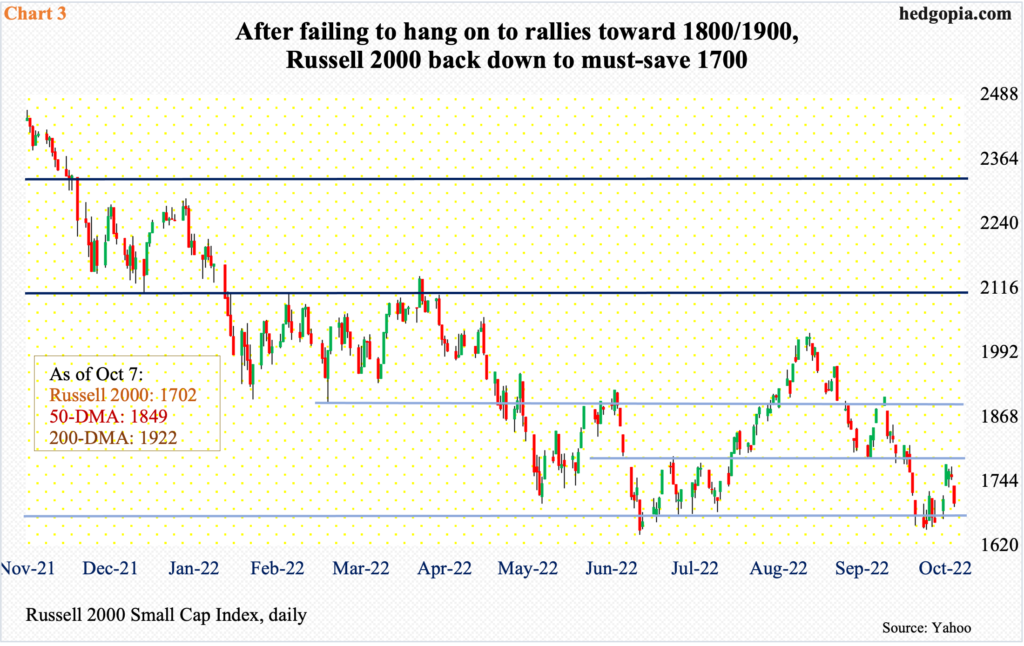
The Russell 2000 is acting different in that its June low is intact – the September 27 low of 1651 versus the June 16 low of 1641. Last week’s low of 1672 was posted on Monday, with the small can index closing above 1700 in all five sessions. This level has a lot of memory attached to it as this is where the index broke out of in November 2020.
A decisive recapturing of 1700 opens the door toward 1800, and then 1900. Last Tuesday, the Russell 2000 managed to rally to 1776 before weakening in the subsequent sessions, ending the week at 1702 (Chart 3). At least a test of 1640s-1650s is probable in the sessions ahead.
Amidst this, there are some interesting things happening in VIX.
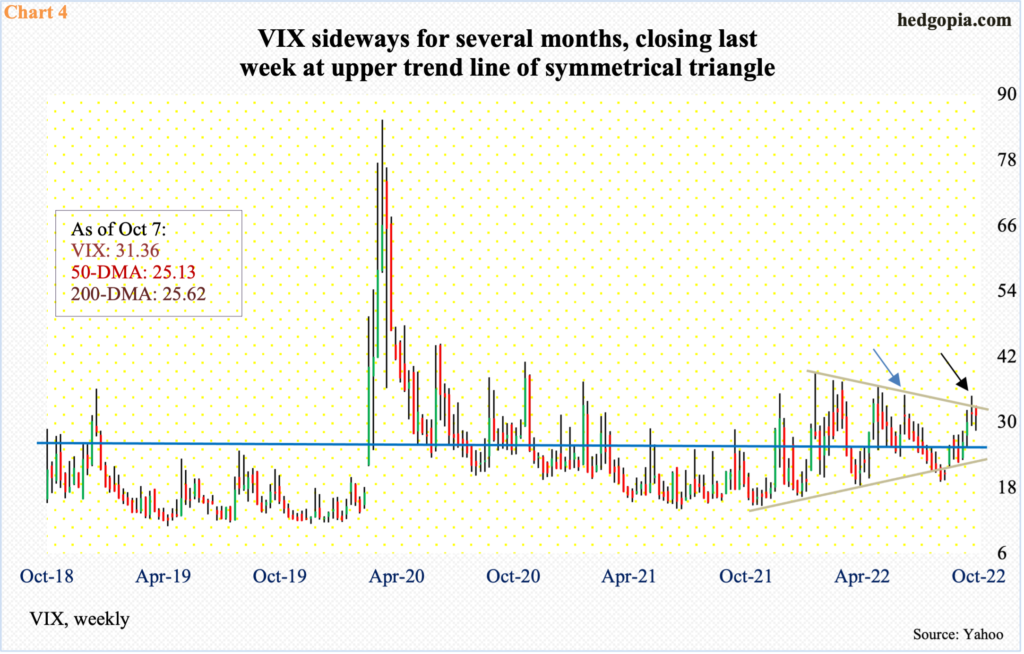
Last week, the volatility index dropped 0.8 percent to 31.36, recovering massively from down 9.9 percent at Wednesday’s intraday low of 28.50.
In the week before that, VIX ended with a weekly spinning top, which also formed in the week of June 3 (blue arrow in Chart 4). Back then, it proceeded to drop for eight straight weeks. This time, too, as explained earlier, VIX fell 0.8 percent last week but was down a lot more mid-week. As a result, time will tell if the weekly candle that formed is a hanging man or a bullish hammer. If it is the latter, volatility can perk up.
This will be the case should VIX manage to break out of the symmetrical triangle it has been in the past several months. Last week, it closed right at the upper trend line.
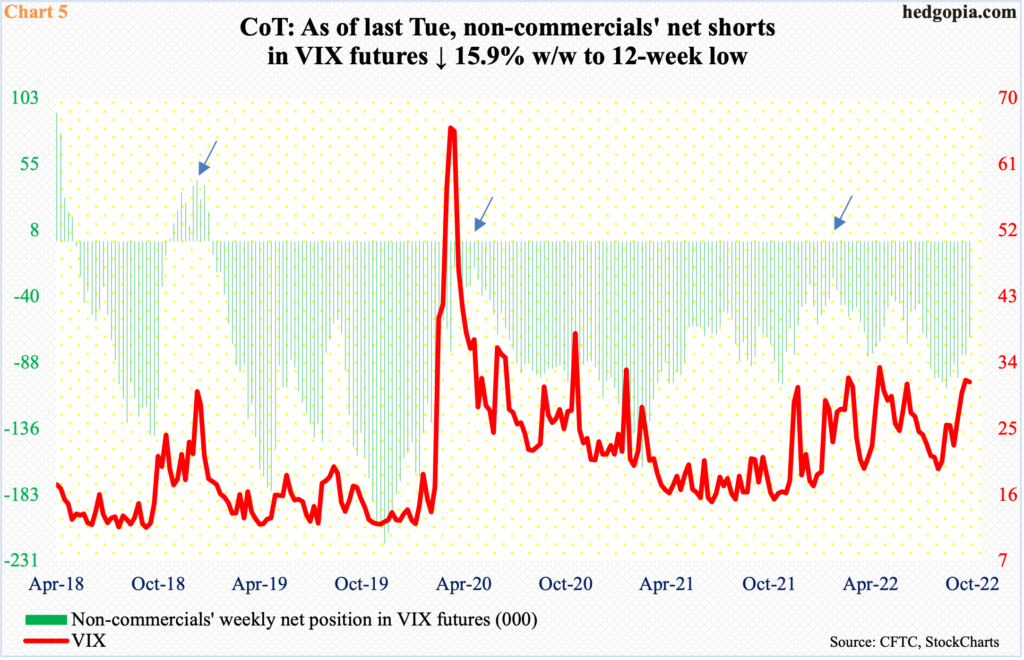
In the meantime, non-commercials are acting as if they expect VIX to rally.
As of last Tuesday, these traders were net short 69,539 contracts in VIX futures, down 15.9 percent week-over-week to a 12-week low.
They have been cutting back. In the week to August 23, which was seven weeks ago, they were net short 106,345 contracts.
Historically, holdings are still elevated. If past is prelude, VIX tends to peak once these traders either go net long or get close (arrows in Chart 5).
Thanks for reading!
