
Equity volatility looks to be on the brink of a rally. The only question is if it will sustain higher or momentum will soon peter out as has been the case since its explosion in February-March last year.
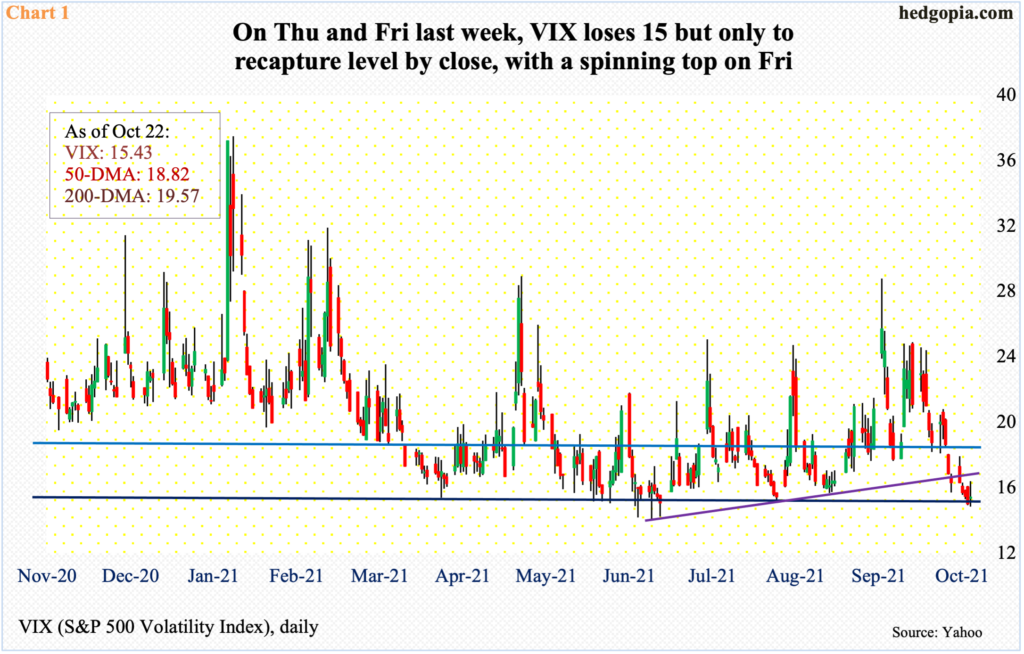
VIX shed 5.3 percent last week – its third consecutive negative week and fourth in the last five. Five weeks ago – or on September 20, to be precise – the volatility index tagged 28.79. A lower high of 24.89 was posted on October 1, after which it has been all downhill, rising in only four of the 16 sessions, including last Friday.
Last week, VIX breached 15 on both Thursday and Friday – touching 14.92 and 14.84 respectively but also reclaiming the handle by close. On Friday in particular, a spinning top formed (Chart 1).
The daily is oversold and could be getting ready to rally.
The weekly RSI ended last week at 44.73. Going back several years, the metric has not breached low-40s. If momentum wanes further to test this support, VIX could proceed to weaken a tad. In late June-early July, 14-plus routinely held, with a low of 14.10 on June 29.
Of note, since VIX (15.43) peaked at 85.47 in March last year, it has progressively made lower highs. It will take a substantial pickup in volatility to break that downtrend. Even if VIX rallies near term, it is too soon to bet on that outcome right here and now.
This week is key.
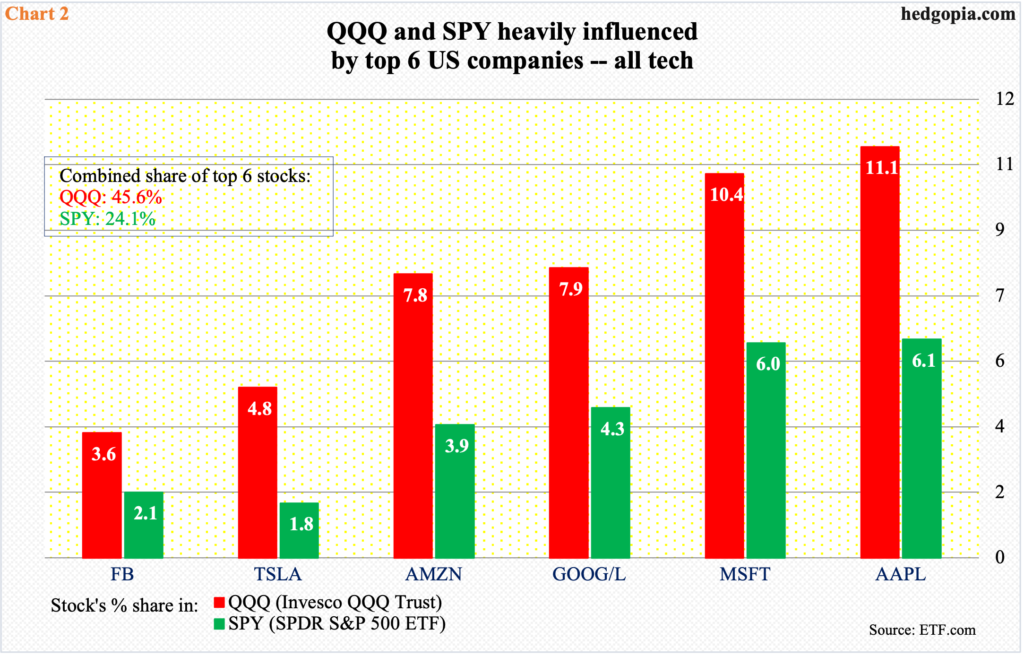
The largest five US companies – Apple (AAPL), Microsoft (MSFT), Amazon (AMZN), Google owner Alphabet (GOOG) and Facebook (FB) – report their September quarter. FB reports on Monday, MSFT and GOOG on Tuesday, and AAPL and AMZN on Thursday.
Their influence on market cap-weighted indices is just too big to ignore. Along with Tesla (TSLA), which is the sixth largest by market cap, they account for 24.1 percent of SPY (SPDR S&P 500 ETF), with both AAPL and MSFT accounting for six percent or higher each (Chart 2).
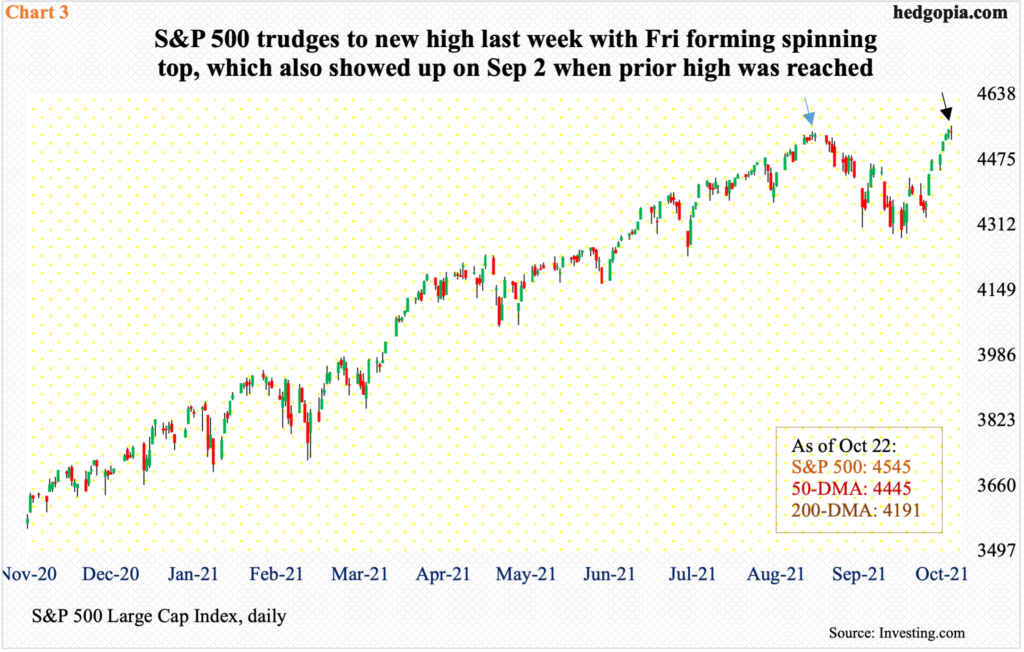
Ahead of this, the S&P 500 acts better versus its peers. It has rallied for three weeks in a row to a new high, having bottomed on October 4 at 4279.
Last Thursday, after rallying for seven consecutive sessions, a new intraday high of 4551 was scored. This was then surpassed on Friday as the index tagged 4560 intraday but the session ended down 0.1 percent to 4545, forming a spinning top (black arrow in Chart 3). A spinning top also formed on September 2, as well as on the 3rd, when the S&P 500 reached its prior high of 4546 (blue arrow). It subsequently lost 5.9 percent through October 4.
The Big 6’s influence on the Nasdaq 100 is even bigger. In QQQ (Invesco QQQ Trust), their combined share is 45.6 percent (Chart 2).
Tesla (TSLA) reported last week and drew positive reaction, pushing the stock to a fresh high. But it was already acting well going into earnings. Four of the other five are not. Only MSFT rose to a new high last week. AMZN, GOOG and FB are below their 50-day, and AAPL is barely above the average.
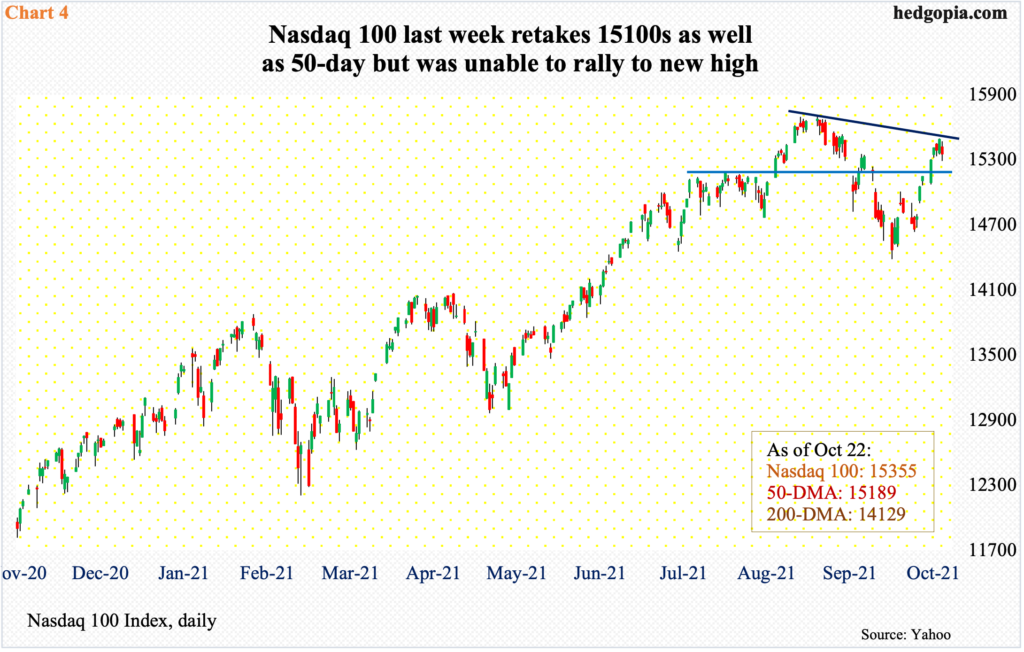
The Nasdaq 100 (15355) started last week by recapturing the average, which also lined up with straight-line resistance at 15100s (Chart 4). By Thursday, the tech-heavy index came within 1.3 percent of the record high 15701 set on September 7 before pulling back a tad on Friday. From the October 4 low through last week’s high, it rallied 7.7 percent. Earlier from the September 7 high, the index declined 8.4 percent.
As opposed to the S&P 500, the Nasdaq 100 failed to rise to a new high last week. Going into a major earnings week, this probably does not help boost tech bulls’ confidence.
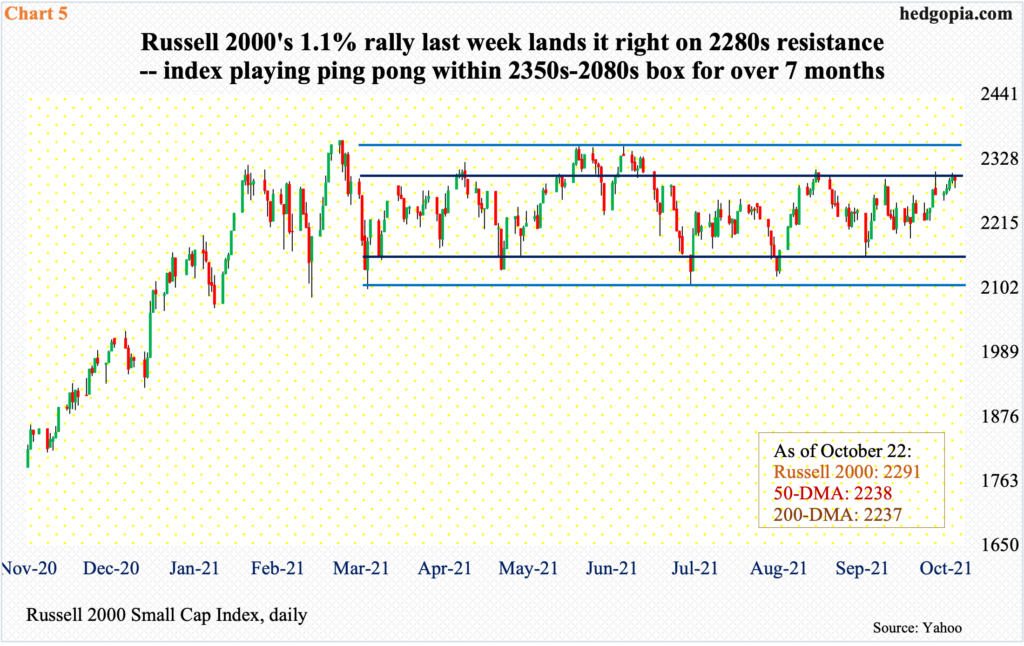
On the other side of the spectrum, small-cap bulls rallied enough last week to land right on crucial resistance.
The Russell 2000 (2291) has been rangebound between 2350s and 2080s for over seven months now. Within this rectangle lies another range between 2280s and 2150s (Chart 5).
At last Thursday’s high of 2304, the small cap index was 2.4 percent from the record high posted in March this year. A breakout at 2280s opens the door toward that high. Bulls keep hammering on 2280s. Just a week ago, on the 15th, they were vehemently denied at that level with a daily shooting star. Now, they are back at it again.
From this perspective, large-caps are leading, in that the S&P 500 last week managed to edge past its September 2 high. Even here, there is a bit of a divergence, as the S&P 100, which represents the top 100 within the S&P 500, did not quite rally to a new high last Thursday, coming within 0.1 percent of its September 2 high.
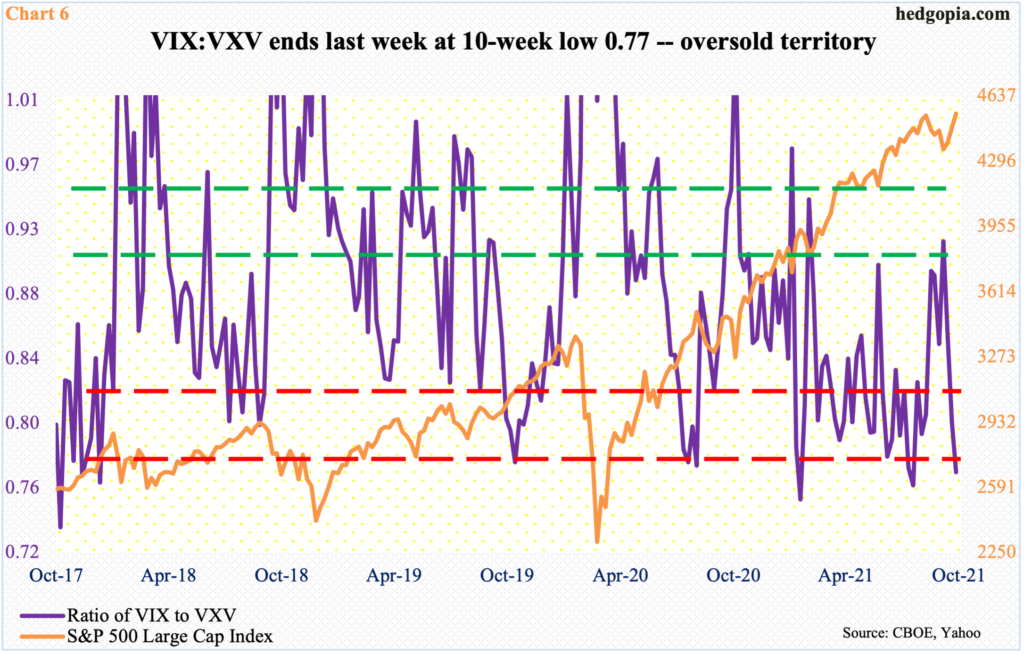
Concurrently, VIX, as explained above, acts like it wants to rally. In this scenario, the ratio of VIX to VXV has room to rally.
VIX measures expectations for 30-day volatility using S&P 500 options. VXV does the same except it goes out to 90 days. When traders are in a mood to take on risk, shorter-term contracts lose premium faster, in this case VIX. A lower ratio hence suggests nearer-term volatility is suppressed.
The ratio closed out last week at 0.77 – a 10-week low. There have been times in the past when VIX:VXV remains suppressed for several weeks/moths before it explodes high. That said, the oversold condition the ratio finds itself in will unwind sooner than later. When that happens and as premium for nearer-term protection rises, equities tend to come under pressure.
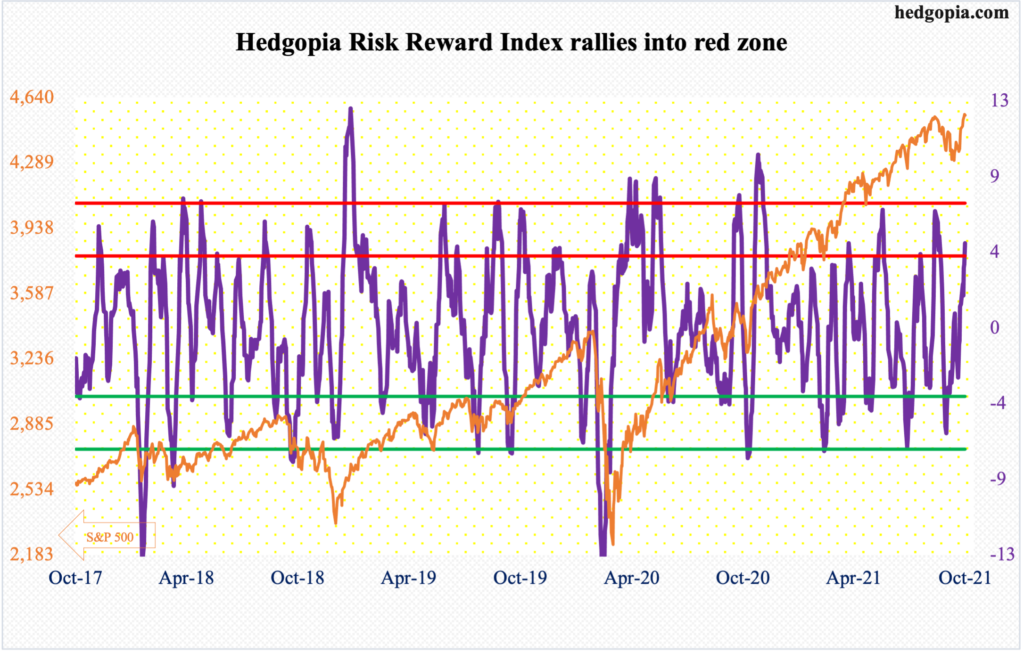
A similar message is also coming from our own Hedgopia Risk Reward Index, which edged into the red zone last Friday.
To be fair, the index can continue rising, or diverge with the S&P 500, as has been the case in the past. But, more often than not, it has paid to act defensively once it rallies into overbought territory.
Thanks for reading!
