
With a feeble rectangle breakout and rejection at the upper end of a rising channel last week, SPY is giving out signs of fatigue.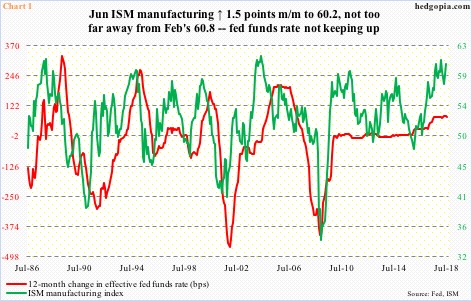
Things look good. Even great, some might argue. This Friday, the first print of 2Q18 GDP comes out. As of July 18, the Atlanta Fed’s GDPNow model forecasts 4.5 percent growth. This would be the fastest growth in 15 quarters, and follows two three-plus growth in prior four.
Manufacturing is robust. The ISM manufacturing index in June rose 1.5 points month-over-month to 60.2, not that far away from February’s 60.8, which was the strongest since May 2004 (Chart 1).
Low interest rates have helped, as the fed funds rate, unlike in the past, has not kept pace with the increase in manufacturing activity.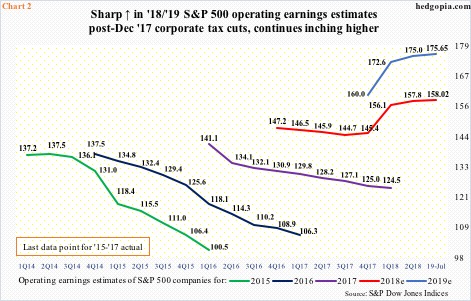
Earnings are great. S&P 500 companies earned $36.54 out of operations in 1Q18, up 26.8 percent year-over-year. With 24 percent having reported, blended estimates for 2Q are currently $38.82, which, if sticks, will be up 27.2 percent over the corresponding quarter last year.
Estimates for both this year and next shot up post-tax cuts. The Tax Cuts and Jobs Act of 2017 was signed into law on December 22. On December 21, the sell-side was expecting $145.31 for this year. Last Thursday, it was $158.02 – a new high. Similarly, 2019 is at $175.65, also a new high. In 2017, these companies earned $124.52.
The shift in the revision trend for both this year and next is evident in Chart 2.
With that said, this kind of growth is not sustainable. For the most part, this is one-time and owes to the tax cuts. This is also true with the current strength in manufacturing, etc. It cannot be sustained.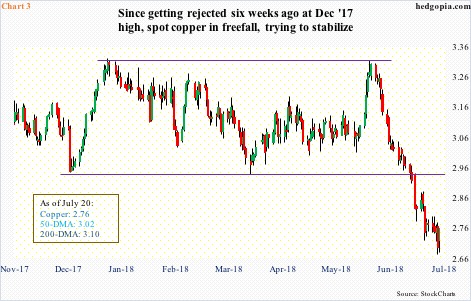
Incidentally, copper on June 7 failed at the December 2017 high of $3.322/pound. Since that rejection, the bottom fell out of the metal. Last Thursday, it made an intraday low of $2.674. Both the 50- and 200-day moving averages have been lost in the process (Chart 3).
Copper is an industrial metal. The signal coming from it may not be as clean as in the past, since increasingly it has also become a financial product. Further, trade tensions between the US and China do not help. Prices of base metals such as aluminum, zinc and copper have tumbled of late. China drives demand for these metals. Nevertheless, Dr. Copper may very well be trying to tell us something.
Near term, some reprieve is possible in copper, as the daily chart is extremely oversold.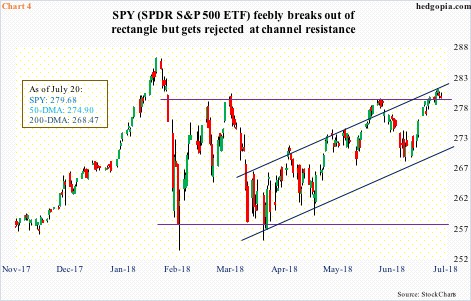
If copper is forecasting serious deceleration in economic activity, US stocks are not reflecting that. Chinese stocks are. The Shanghai composite index from its January high through a low two weeks ago declined 25 percent, before drawing some bids.
Even if serious deceleration does not occur, it is hard to maintain the current pace of economic activity in the US. Mean reversion is natural. As relates to the ISM index, it is hard to sustain above 60, let alone high-50s.
US stocks are not reflecting this scenario. In fact, post-February 9 bottom the Russell 2000 small cap index and the Nasdaq 100 index proceeded to rally to new highs. The S&P 500 large cap index and the Dow Industrials are still below their late-January highs, although important resistance was tested last week.
SPY (SPDR S&P 500 ETF) has essentially traded in a rectangle the past five months. Last week, it broke out, but feebly, ending the week right on the upper bound. Concurrently, it also kissed the upper end of a rising channel (Chart 4). The path of least resistance is down. A weekly doji showed up last week.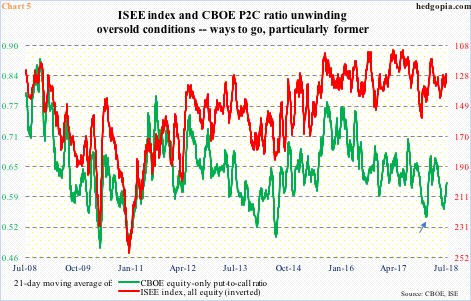
In the right circumstances for the bears, there is plenty of room for unwinding of the optimism that was getting built into options.
In Chart 5, the CBOE equity-only put-to-call ratio is pitted against the ISEE index, all equity. The latter is a call-to-put ratio, hence inverted. A 21-day moving average is used. Recently, both the green and red lines are rising (dropping in the latter’s case).
The green line, for instance, dropped to 0.56 on June 26. For reference, on January 26, when SPY peaked at $286.63, the ratio dropped to 0.543 (arrow), before rising. This time around, the rise in the ratio is yet to accompany a drop in the S&P 500/SPY. In all probability, it is coming. Historically, the ratio can rise to high-0.60s/low-0.70s, before the built-in optimism is unwound. Last Friday, it closed at 0.615.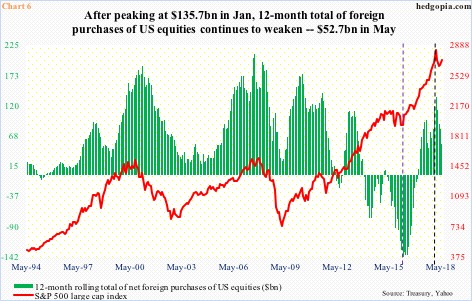
In this respect, it should be noted that the January peak in SPY/S&P 500 coincided with a peak in 12-month running total of foreign purchases of US equities. In May, foreigners sold $26.6 billion worth. On a 12-month basis, purchases were $52.7 billion in that month, down from $135.7 billion in January (black dashed vertical line in Chart 6).
Of note, in February 2016 when the S&P 500 reached a major bottom, foreigners were selling $145.3 billion worth. Selling peaked in that month (indigo dashed vertical line). Directionally, the red line and the green bars do tend to move hand in hand. In essence, foreigners have used the strength post-February low to lighten up. This is more of a medium- to long-term issue. Near-term, as explained above, SPY faces downside risk, and use of options can at least help earn some premium.
SPY Aug 3 bear call spread:
- Short 280 at $1.80
- Long 281.50 at $1.05
SPY closed last week at $279.68. Hypothetically, an August 3 (two weeks to go) credit call spread in which slightly-out-of-the-money 280 is sold and 281.50 bought for protection earns $0.75 in premium. Breakeven is $280.75. Amount at risk is $0.75, with decent odds of success.
Thanks for reading!
