
As of last Thursday (July 21st), as per S&P Dow Jones Indices, 123 of S&P 500 companies reported their 2Q16 results, 81 of them beat on an operating basis, 23 missed and 19 met consensus estimates. On a reported basis, only 53 beat, and on sales 68.
With only one-fourth reporting, the beat ratio on an operating basis is 66 percent, slightly lower than in recent quarters. But the reporting season has just begun, so this metric can always improve. The real metric deserving of attention lies elsewhere.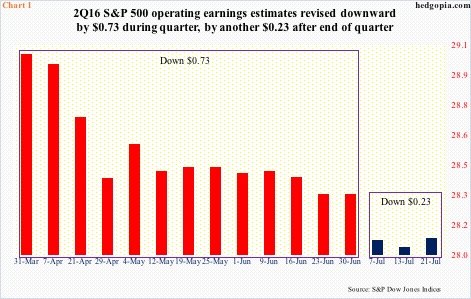
It is no secret that for at least the last several years, consensus operating estimates have started out very optimistic, only to get progressively revised downward as time passes. At the end of 2Q14, 2015 was estimated to bring in $137.50, ended up earning $100.45; 2016 at 4Q14 was at $137.50, is now at $113.65.
Along the same lines, 2Q16 estimates at 1Q15 were $33.27, and got chopped to $29.05 when the quarter began. During the quarter, they went down by another $0.73, to $28.32, and by another $0.23 in the three weeks after the quarter ended (Chart 1). This is what is depicted in Table 1.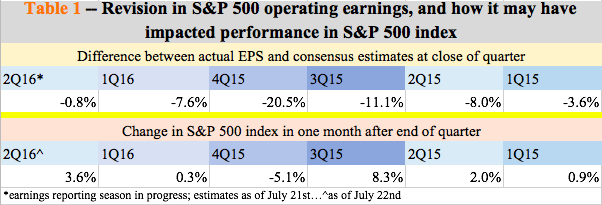
Going back five quarters to 1Q15, each ended up earning less than what was expected as the quarter closed. For instance, in 1Q16 the gap was 7.6 percent – expected to earn $25.94 at the end of March versus $23.97 in actual earnings.
In other words, even after the reporting season begins, the bar keeps getting lowered. As a result, within a month of the quarter-end – during which the majority of companies would have reported – the S&P 500 trades higher. The fourth quarter last year was an exception. This time around, like clockwork, three weeks after the end of the quarter, the index is up 3.6 percent.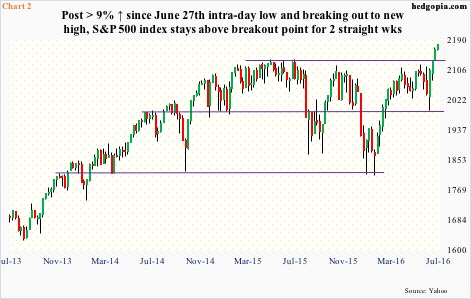
Last week, the S&P 500 rallied another 0.6 percent – up nine-plus percent since the June 27th intra-day low. Encouragingly for the bulls, the index has remained above the breakout point for two consecutive weeks. That said, momentum is decelerating – with the index respectively up 3.2 percent, 1.3 percent, 1.5 percent, and 0.6 percent in the last four weeks.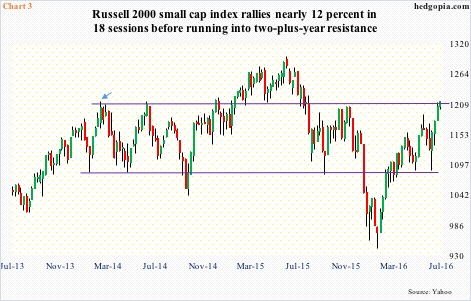
The spoilsport continues to be small-caps. The Russell 2000 small cap index has lagged the S&P 500 since March 2014. That was when the former began to go sideways (arrow in Chart 3). Except for a breakout in February last year lasting six months, this resistance has been a tough hurdle to jump over. Once again, this ceiling is being tested.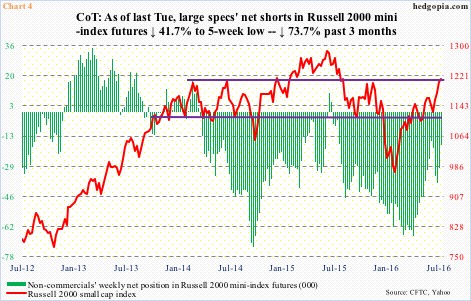
Off the June 27th intra-day low, the Russell 2000 has rallied nearly 12 percent, and closed last Friday right on that resistance (Chart 3). Throughout all this, non-commercial futures traders have been a big help. Net shorts in Russell 2000 mini-index futures have dropped 49 percent since the week ended June 28th (Chart 4). That said, the squeeze tailwind is no longer as potent.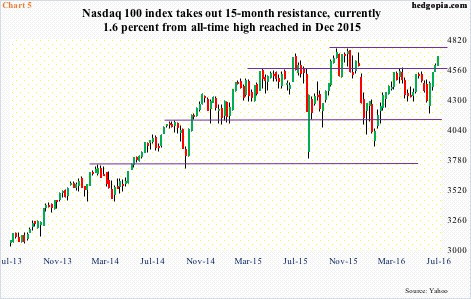
Techs have been laggards as well, but they have been making up for the lost time, with the Nasdaq 100 index up 1.7 percent last week, outperforming major U.S. peers. Earnings have helped. In the S&P 500 so far, two-thirds beat in operating earnings. In information technology, the beat ratio is 70 percent (14 of 20 companies). Last week’s rally put the index convincingly past resistance from April last year. Nevertheless, unlike the S&P 500 and/or the Dow industrials, it is yet to score a new high (Chart 5).
Daily technicals are grossly overbought, but if last week’s momentum continues, a new high is achievable on the Nasdaq 100. Similarly, the Russell 2000, which has lagged the S&P 500 anyway, a breakout is possible should the latter at least hold its ground for a week or so.
What could throw a monkey wrench into this scenario?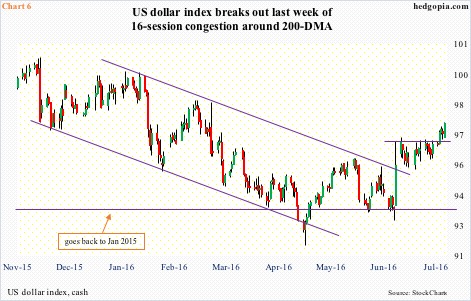
The FOMC begins a two-day meeting this Tuesday. They are not going to move. That is the least of markets’ concern. There is no press conference scheduled. After this, there will be three more meetings this year – September 20-21, November 1-2, and December 13-14, with press conference scheduled for September and December.
Odds favor the post-meeting statement on Wednesday will try to straddle the neutral line. The US dollar index, on the other hand, acts as if it expects a hawkish message. It rallied one percent last week – 1.9 percent in the last three – in the process breaking out last week of 16-session consolidation around its 200-day moving average.
Daily technicals are grossly overbought on the dollar index; weekly less so but beginning to get overbought. If the FOMC does not oblige, there is room for downward pressure.
Here is the rub.
Over the past six or seven years, the dollar index has had positive correlation with the S&P 500, with R in the high 0.70s – 0.78 to be exact in the past six years. Going back to the beginning of 1990, the two do not show any correlation. The implication being a down dollar index has the potential to drag the S&P 500 lower.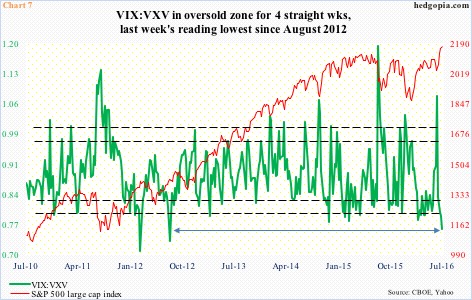
In this respect, there is a ton of unwinding left on the S&P 500, as well as other metrics. The VIX-to-VXV ratio, in oversold territory last four weeks, was in the high 0.70s in the last two. Last week’s reading of 0.76 was the lowest since August 2012 (Chart 7). Long story short, if past is prologue, once the ratio gets this oversold, it has shown a tendency to quickly snap back, not go sideways.
This scenario does not bode well for breakout – or sustainable breakout – hopefuls on the Russell 2000.
Thanks for reading!
