
Last Friday, the CBOE equity-only put-to-call ratio registered a reading of north of one. This does not occur very often.
With this, the 21-day moving average rose to 0.766, not that far away from the September 18th (2015) high of 0.785 (Chart 1).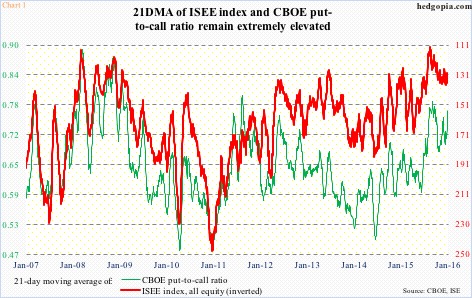
The 1.14 reading came – not surprisingly – in a session in which stocks were taken to the woodshed, with major U.S. indices dropping in the two to three percent range last Friday.
The last time there were at least a couple of consecutive one-plus readings was in the middle of June 2011, when there were three in succession. Since then, there have been five instances in which the ratio rose over one, only to slip right back under in the very next session.
They are as follows:
- January 15, 2016 (1.14): Remains to be seen what happens to the ratio and how stocks fare next.
- December 28, 2015 (1.21): The S&P 500 peaks in the very next session, and through last Friday’s low, drops nearly 11 percent.
- August 21, 2015 (1.04): The S&P 500 bottoms in the next session, although the lows were retested in September.
- August 1, 2014 (1.04): The S&P 500 bottoms four sessions later.
- August 19, 2011 (1.03): The S&P 500 bottoms the next session, although that low was tested a month later.
- August 8, 2011: (1.07): The S&P 500 bottoms the next session.
Hence, in four of the five above, stocks immediately rallied post one-plus reading. In the one instance in which the opposite took place – in late December last year – the 1.21 reading was preceded by three straight readings in the 0.50s; leading into this, market participants obviously were not fearful enough.
This time around, last Friday was preceded by six readings in the 0.80s and 0.90s – three in the 0.90s. The 10-day ratio was 0.86 on Friday, versus 0.69 on December 28th. There is a palpable sense of fear this time around, thus substantially raising the odds of a rally (in stocks) at least near-term.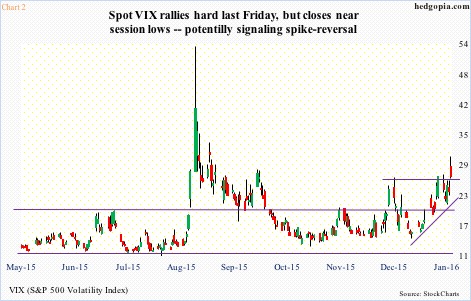
Concurrently, spot VIX is beginning to flash signs of fatigue. Last week, in a week in which the S&P 500 rallied 2.2 percent, VIX was essentially unchanged – 27.02 versus 27.01 last week. It is currently sitting right on 27 support, but the odds of it going lower have grown. Momentum indicators are way overbought near-term, and Friday could very well have flashed a spike-reversal signal (Chart 2).
Given the shellacking stocks have received, it can be argued that spot VIX should have risen much more. Friday saw a spike above the upper Bollinger Band, but most of it was given back.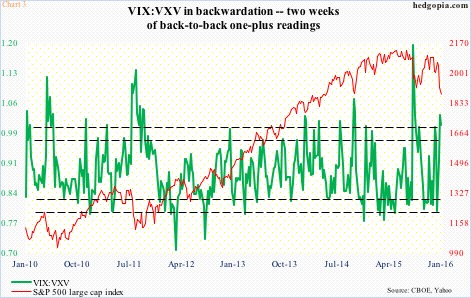
This is taking place at a time when VIX:VXV has produced back-to-back weekly readings of backwardation – 1.01 and 1.03. This itself is a suggestion that the market expects volatility to subside. In this scenario, the green line in Chart 3 needs to unwind tons of overbought conditions – hence potentially good news for stocks.
Thanks for reading!
