On a 12-month basis, the US budget deficit may have peaked, but at the same time the Fed is also getting ready to taper. In the past, the 10-year peaked mid-way through QE. From this perspective, the March high of 1.57 percent could prove to be important.

Before Covid-19 began to ravage the US economy in the early months of last year, the US budget deficit was already growing. After the virus hit, the red ink went vertical as the government aggressively responded with stimulus and relief packages.
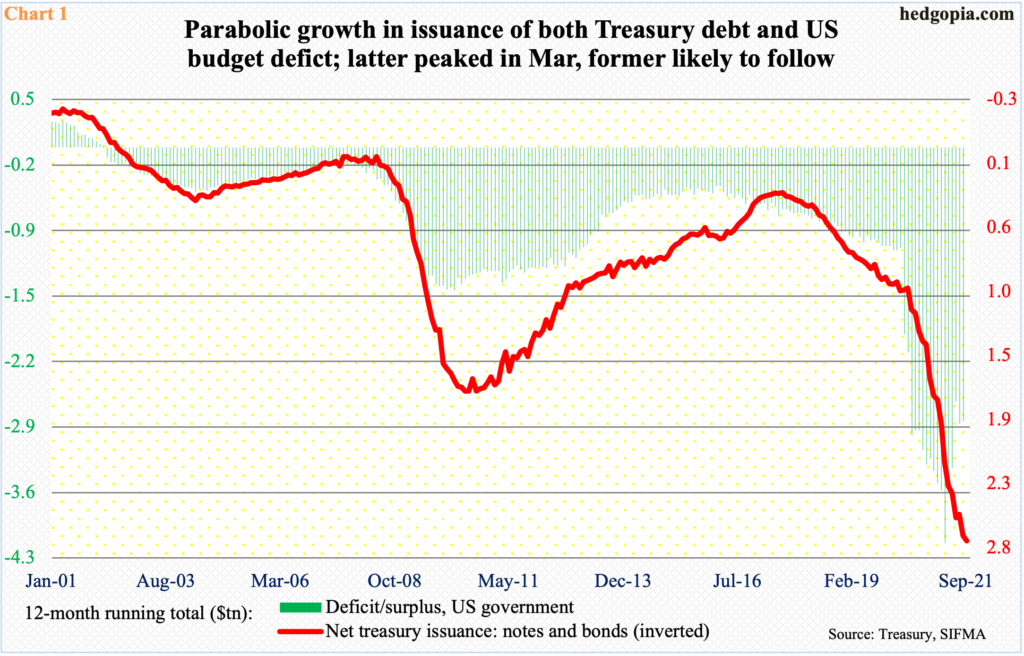
In the 12 months to March ’20, the deficit totaled $1.04 trillion. One year later, by March this year, it hit $4.09 trillion. It has come under pressure since, with August standing at $2.84 trillion. The issuance of treasury notes and bonds is yet to catch up with it.
In the 12 months to September, the Treasury issued $2.74 trillion in notes and bonds – a record. As Chart 1 shows, the two metrics tend to move hand in hand. As the deficit drops, the Treasury will sooner or later respond with less issuance of debt. At least in theory, this should help put downward pressure on the long end of the treasury yield curve.

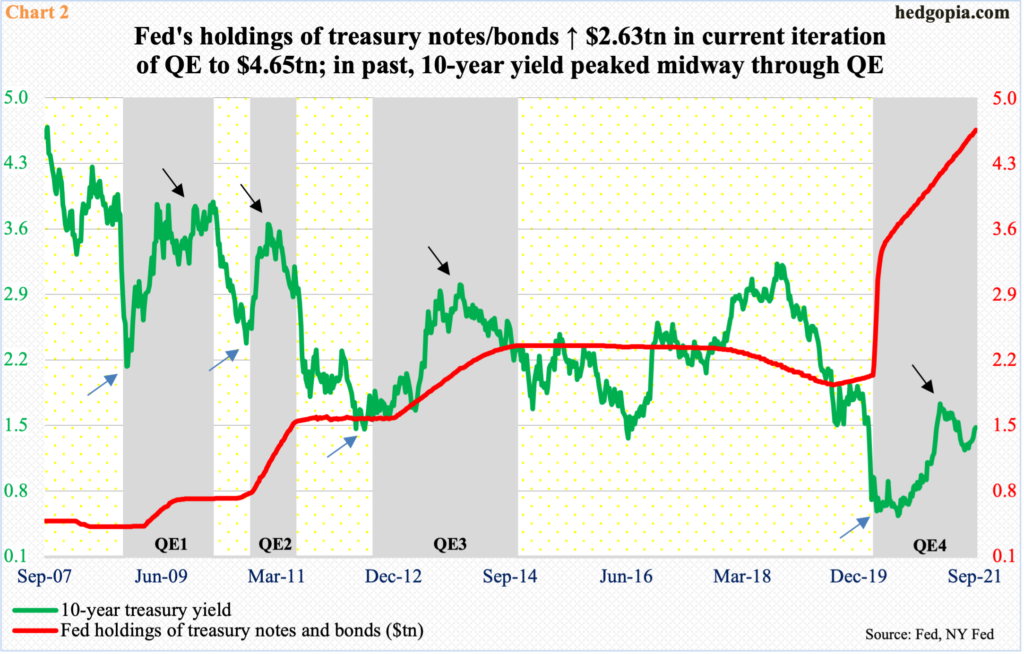
Then, we have this dynamic. As did the government, the Federal Reserve, too, took aggressive steps to mitigate the disruptions caused by the virus. Besides lowering the fed funds rate to zero-bound, it massively expanded its balance sheet (Chart 2).
In early March last year, the Fed held $4.24 trillion in assets. This has now doubled to $8.45 trillion (as of Wednesday last week). Every month, it buys up to $80 billion in treasury notes and bonds and $40 billion in mortgage-backed securities.
In the meantime, the US economy has recovered. Several metrics, including real GDP, have surpassed the pre-pandemic highs. At the September 21-22 FOMC meeting, Chair Jerome Powell set the stage for a tapering announcement in November. There were also hints that rates may rise sooner than expected. The 18-person FOMC was evenly split on the prospects for a rate hike next year.
All things remaining equal, this is a recipe for higher yields.

Post-FOMC meeting, the 10-year has spring to its feet.
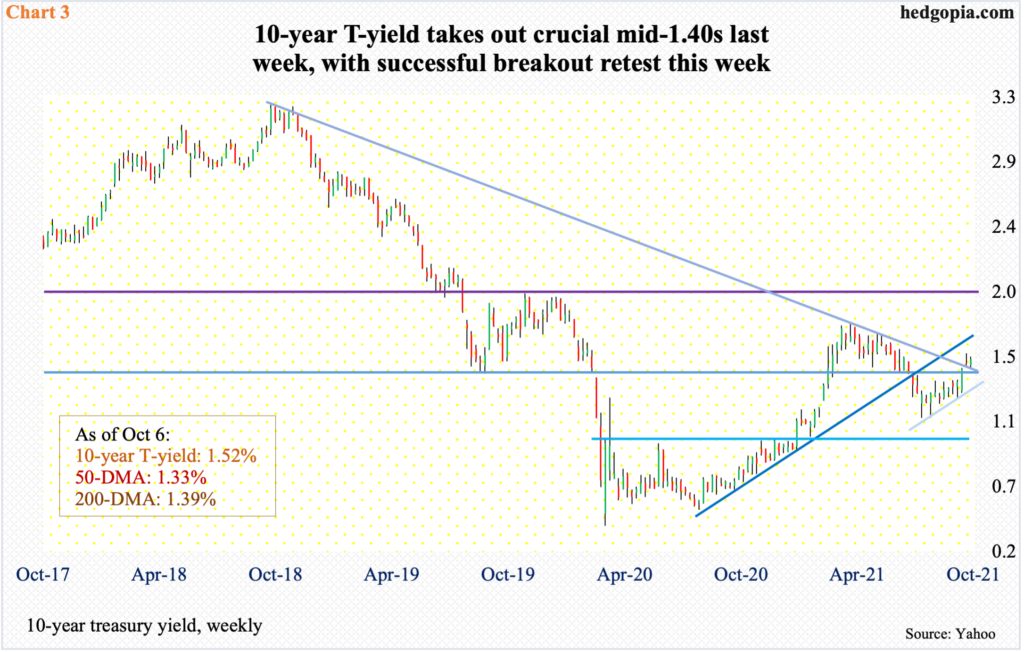
On the final day of the meeting on the 22nd, rates defended the 50-day to close at 1.34 percent, followed by the reclaiming of the 200-day in the following session. Come September 24, rates pushed through mid-1.40s, which was breached in February last year, before tumbling to bottom at 0.4 percent in the following month. It was not until February this year that bond bears (on price) were able to reclaim the level. Rates then peaked at 1.77 percent on March 30, before once again proceeding to lose the threshold in early July. This time around, it took the bears two and a half months to reclaim the level.
Last week’s mid-1.40s breakout came in a weekly shooting star session (Chart 3). The 10-year (1.52 percent) has trended higher for some time, so it is perfectly normal to flash a fatigue sign. That said, it remains above the breakout. To boot, rates also pushed through a declining trend line from October 2018.
As things stand, the benefit of the doubt remains with the bears. On Monday, they successfully defended the breakout. But this would not be the last time they would be locking horns with the bulls in order to save mid-1.40s.
In one scenario, the 10-year can rally further to test a rising trend line from August last year. This also approximates the March high. Further, a 50-percent retracement of the October 2018-March 2020 decline comes to 1.82 percent.
And there is this. During the last three iterations of quantitative easing, the 10-year yield dropped in the weeks leading up to that, bottoming around the time the Fed began purchasing these securities. Rates also tended to peak toward the middle of QE (black arrows in Chart 2). If past is prelude, the March high of 1.77 percent could prove to be important.
Thanks for reading!

