
Stocks rallied for three months in defiance of deteriorating macro data. By essentially putting an end to the tightening cycle, the Fed is acknowledging this. Stocks could be the next.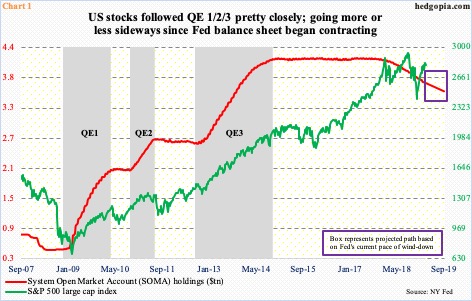
What just happened?
Many are probably asking that question after witnessing the Fed surprisingly make a sharper-than-expected dovish turn last Wednesday. It now wants to put an end to its tightening cycle. There will be no more rate hikes this year. The last hike was last December, which was a ninth 25-basis-point increase in the fed funds rate since the Fed began raising it in December 2015. The bank also plans to end the ongoing balance sheet wind-down in September. It began to run it down in October 2017. Currently, up to $60 billion a month can roll off. As of last Wednesday, System Open Market Account (SOMA) holdings stood at $3.76 trillion, down from a peak of $4.24 trillion in April 2017.
In the next six months, if the Fed maintains the current pace of reduction, SOMA holdings by September could potentially drop to $3.6 trillion (Chart 1), which is still massive. Prior to three iterations of quantitative easing (QE), they were $500 billion. At the same time, the benchmark rate is just barely above the inflation rate – 225-250 basis points versus consumer inflation in the two percent range. In other words, the conventional monetary quiver does not have enough arrows. Yet, the Fed wants to move to the sidelines. It now expects 2.1 percent growth this year, down from the 2.3 percent it forecast in December. If it comes to pass, this is still decent growth. Yet, the message is mixed.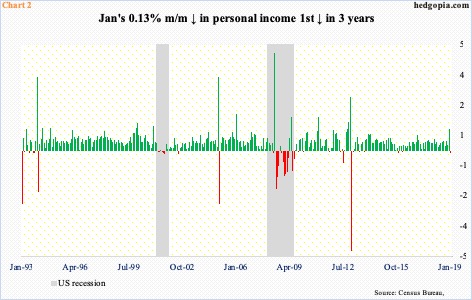
The US economy is in clear deceleration. Real GDP went from growth of 4.2 percent in 2Q18 to 3.4 percent in 3Q to 2.6 percent in 4Q. If the Atlanta Fed’s GDPNow forecast is right, the current quarter is on pace to growing at a 1.2-percent pace.
The job market is strong. Even here, February only produced 20,000 non-farm jobs, although January was strong at 308,000. Inflection points can be tricky. In January, personal income fell 0.1 percent month-over-month to a seasonally adjusted annual rate of $18 trillion. This was the first m/m decline in three years (Chart 2).
The economy is just three months from completing a decade of recovery/expansion, and it is showing its age. The Fed did raise rates for three years through last December, but when it began raising them they were literally at zero. At less than 2.5 percent, the fed funds rate is hardly restrictive – in ordinary circumstances, that is. These are no ordinary times. Post-financial crisis, it is increasingly taking more debt to produce the same amount of output. Overall leverage is higher now versus prior to the onset of the financial crisis.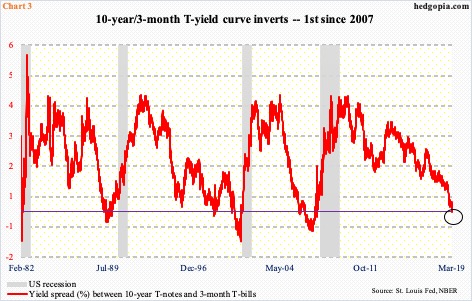
Amidst all this came inversion in parts of the Treasury yield curve last Friday. Inversion is considered to be a reliable indicator of recession. Traders pay particular attention to the difference between yields on 10-year notes and three-month bills. Last Friday, the spread slipped into negative territory – the first such occurrence since 2007 (Chart 3).
Inversion occurs as demand for longer-term bonds goes up in fear of bad times in the economy. Most recently, the 10-year T-rate peaked at 3.25 percent early October last year and closed Friday at 2.46 percent. For nearly two and a half months until the middle of this month, bond bears tried to defend major support at 2.62 percent, but were unsuccessful. That support is now gone. In due course, the 10-year could very well be headed toward two percent. Near term, the daily is extended.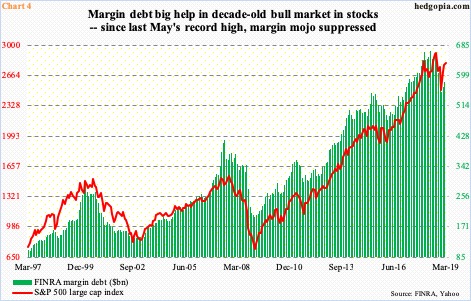
Should the economy contract – or even decelerate sharply – stocks could be in for rough times ahead. As is the case with the economy, the bull market has been chugging along for a while. It turned 10 this month. By the way, the S&P 500 large cap index needs to make a new high. Else, the all-time high of 2940.91, which was reached on September 21 last year (and a closing high of 2930.75 one day prior), stands.
Margin debt was a big help. From $199.7 billion in February 2009 through last May’s record $668.9 billion, FINRA margin debt more than tripled. The relationship between it and the S&P 500 is evident in Chart 4. Since that peak, margin debt dropped to $554.3 billion in December, before rising in January and February to $581.2 billion. The S&P 500 bottomed post-Christmas. As goes margin debt, so do stocks – another example of the role of leverage. Since last year’s high, margin mojo is lacking.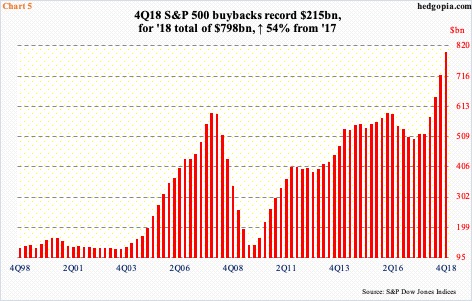
Along with margin debt, one of the major pillars holding up the bull market has been corporate buybacks. Since peaking at $161.4 billion in 1Q16, buybacks by S&P 500 companies came under pressure. Then came the tax cuts of December 2017, giving a new leash of life to buybacks. Last year, each quarter was a successive new record.
S&P Dow Jones points out that 4Q data is still coming in, but as of early this month it was $214.5 billion, a new record. For all of 2018, S&P 500 companies spent $797.9 billion in buybacks (Chart 5). Add in $456 billion that was doled out last year in dividends, $1.25 trillion was spent on buybacks and dividends – a new record, of course.
As benefits from tax cuts wear off, it is tough to argue if the 2018 momentum continues this year. In the next few weeks in particular, stocks will not be benefiting from this tailwind as buyback blackout begins toward the end of this month.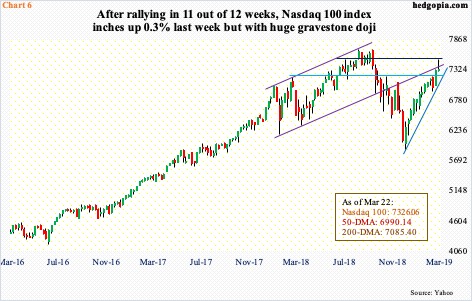
Stocks are vulnerable.
From late-December lows, major US indices all rallied more than 20 percent, before facing crucial resistance. The Russell 2000 small cap index (1505.92) was rejected at 1600-plus a month ago. The S&P 500 (2800.71) rallied to 2860 last Thursday but is struggling to save crucial support at 2800-plus; last week, a weekly shooting star showed up.
The Nasdaq 100 (7326.06) similarly produced a weekly gravestone doji last week; Thursday’s high of 7505.41 was an unsuccessful test of the July 2018 high of 7511.39 (Chart 6). The index was also denied at the underside of a broken one-year rising channel. The next level to watch is horizontal support at 7200, which is where a trend line from late December lies.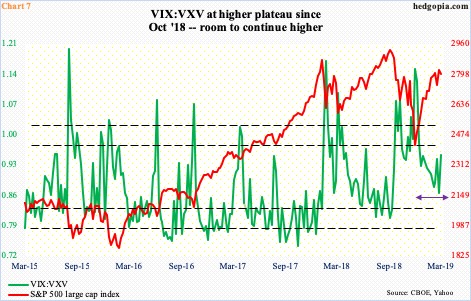
In the options market, investor optimism remains elevated. In seven out of the last 10 sessions, the CBOE equity-only put-to-call ratio produced readings of 0.50s. The 10-day moving average ended last week at 0.583. Late September-early October last year, the ratio hovered around that level for several sessions before the bottom fell out of stocks. The ratio has room to continue higher.
Ditto with the ratio of VIX to VXV. VIX measures the market’s expectation of 30-day volatility implied by S&P 500 options, VXV does the same except it goes out to three months. The ratio rises as demand for near-term protection rises. Since the S&P 500 peaked last September, the ratio has refused to drop to the historical oversold range (bi-directional arrow in Chart 7). Despite the three-month rally in stocks, volatility refuses to die. Continued rise in the green line in the chart tends to put stocks under pressure.
In a scenario in which the Nasdaq 100 comes under pressure in the weeks ahead, here is a hypothetical trade using QQQ.
QQQ May 17th 180/184 credit call spread:
- Sell 180 call at $4.79
- Buy 184 call at $2.79
The spread yields $2 in premium, with $2 at risk. It starts to bleed once QQQ trades north of $182. Thursday, the ETF ($178.56) rallied to nearly-six-month high $182.83. Immediately ahead, there is support at $175.50s. The 200-day moving average lies at $172.67. Depending on how it sells off in the weeks ahead, the spread can even be turned into an iron condor down the line.
Thanks for reading!
