
Amidst continuation of aggressive accumulation of assets by the Federal Reserve and a trial balloon last week by Philadelphia Fed president of eventual tapering, large- and small-caps are going their separate ways – the former liking soft economic data and the latter disliking it.
Last Wednesday, Patrick Harker, the Philadelphia Fed president who becomes a voting FOMC member in 2023, speaking at a virtual event, said, “it may be time to at least think about thinking about tapering our $120 billion in monthly Treasury bond and mortgage-backed securities purchases.”
His mission was to put out feelers, not upset the markets. Hence, he immediately followed that up with “this is not something we are going to do suddenly, though.” No one wants a repeat of taper tantrum of 2013, when treasury yields shot up after the Fed announced it would, at some future date, reduce the pace of purchases of treasury bonds.
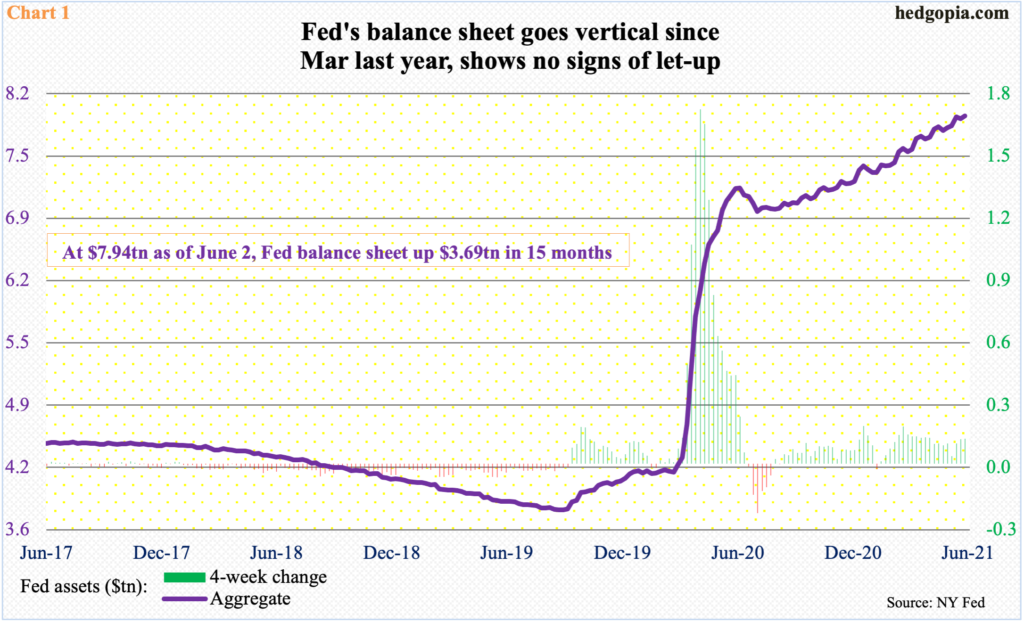
It remains to be seen if these sorts of trial balloons would be sufficient to prepare markets that are hooked on monetary morphine. There is immense liquidity in the system. Fed assets have gone vertical (Chart 1). In early March last year, the central bank held $4.24 trillion in assets, which have since grown to $7.94 trillion.
Right here and now, there is no risk of immediate tapering. The Fed is committed to its current pace of asset accumulation. But at some point, tapering will happen. The question is, will markets suffer from withdrawal symptoms?
Of late, investors have keenly focused on the inflation data. This, despite the fact that the Fed has made it clear its current policy is driven more by jobs than inflation, which it would not mind running hotter than its two percent objective for some time.
Inflation has picked up speed. In the 12 months to April, core CPI jumped three percent and core PCE 3.1 percent – the steepest year-over-year pace since January 1996 and July 1992, in that order (chart here).
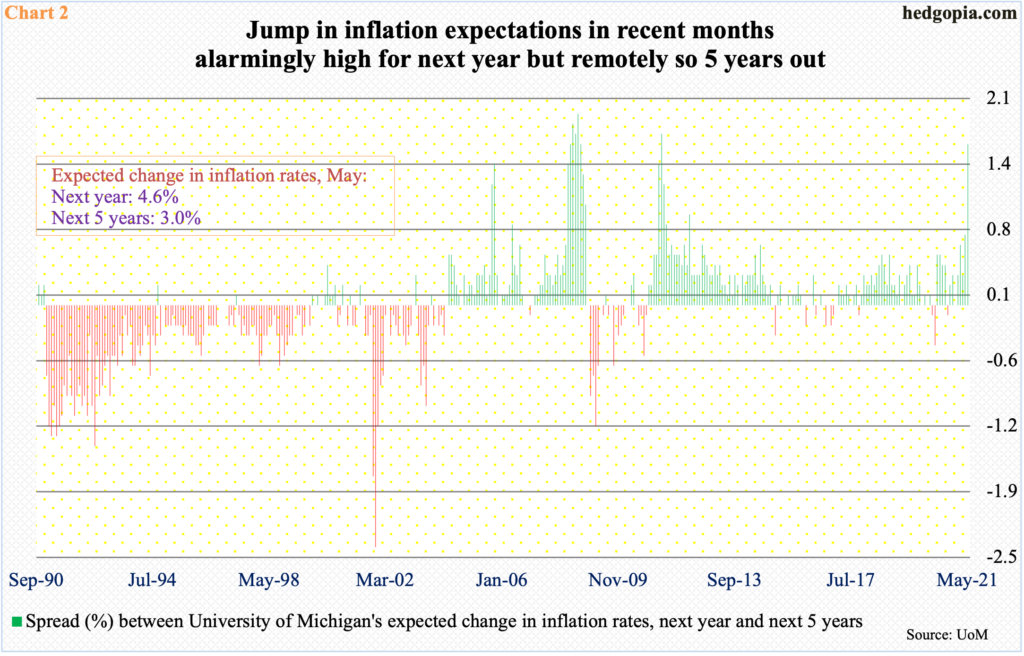
The official line adopted by the Fed is that it is transitory and that there is no need to panic. For the most part, the consensus agrees. Inflationary expectations are not running amok.
In May, respondents to the University of Michigan’s monthly survey expected inflation to strengthen to 4.6 percent next year and then soften to three percent in the next five. Last December, they expected 2.5 percent for both periods. Accordingly, the spread between the two has jumped (Chart 2), but investors are not alarmed because the pickup in price is expected to be transitory.
Markets will be on pins and needles until May’s CPI report, due out this Thursday.
Beneath the calm, some level of investor nervousness can be sensed. Stocks are at a point when they are rallying on bad – both perceived and real – and selling off on good. At this point, a large section of the stock market – large-caps in particular – is not wishing for too strong of a recovery. In search for continuation of Fed largesse, fewer jobs and lesser wages are wished for.
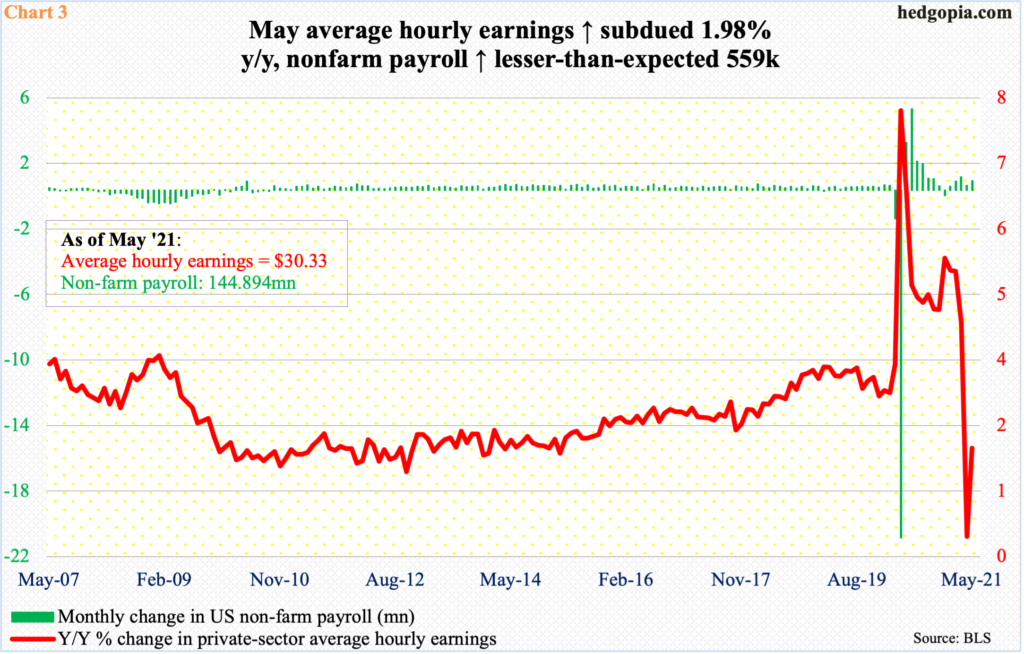
Last Friday, the S&P 500 large cap index rallied 0.9 percent and the Nasdaq 100 index 1.8 percent, to end the week up 0.6 percent each. May’s jobs report was subdued. The economy created 559,000 non-farm jobs, versus expectations of 650,000. Private-sector average hourly earnings were up $0.15 month-over-month to $30.33, up two percent y/y (Chart 3). Large-caps cherished this, but not small-caps.
The Russell 2000 small cap index last Friday was up a subdued 0.3 percent – and up 0.8 percent for the week.
This is the other dynamic in play. Small-caps inherently have more domestic exposure than large-caps. As did the rest of the stock market, the Russell 2000 put in a major low in March last year, but it was not until November that it went parabolic. President Biden won the election early that month, followed by separate announcements by Pfizer (PFE) and Moderna (MRNA) of positive vaccine news. Investors began to price in reopening – and recovery – of the economy.
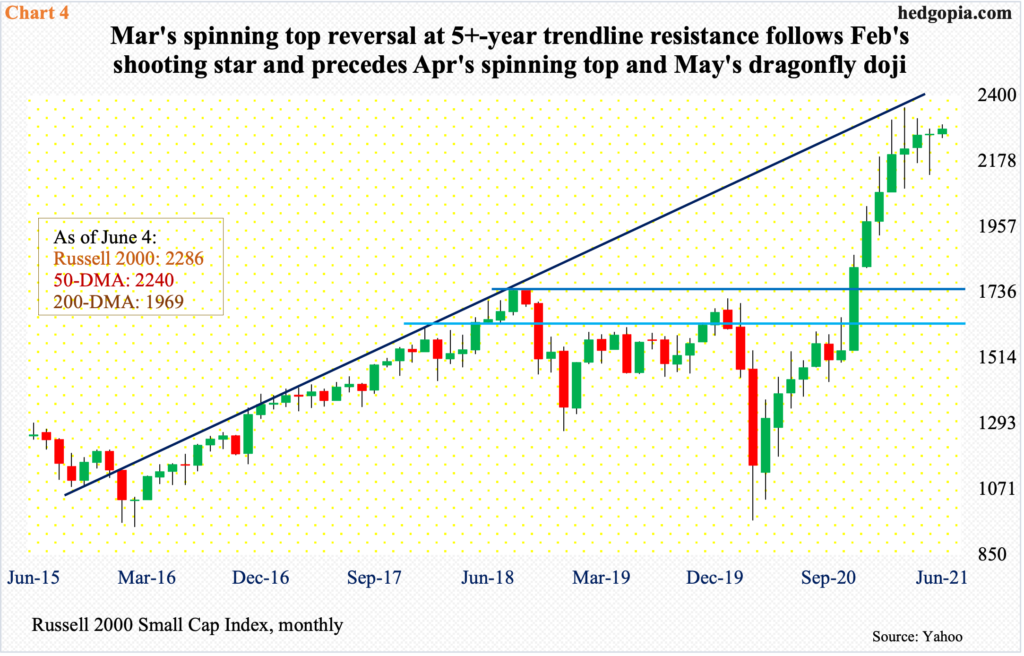
From November’s trough through March’s all-time high of 2360, the Russell 2000 surged north of 53 percent. This has priced in a lot of good news. Softer data, which is what large-caps now want, is not Russell 2000-friendly. The index has begun to go sideways, with the March high having repelled at a five-year rising trend line (Chart 4).
Signs of distribution are popping up. The first two monthly candles this year produced long upper shadows. This was followed by March’s long-legged doji, April’s spinning top and May’s dragonfly doji.
Last week, The Russell 2000 (2286.41) touched 2302 intraday Wednesday to take out straight-line resistance at 2280s, but that proved fleeting. There is horizontal support at 2070s-2080s, which is the neckline of a potential head-and-shoulders formation.
Right here and now, risk-reward odds favor shorts more than longs.
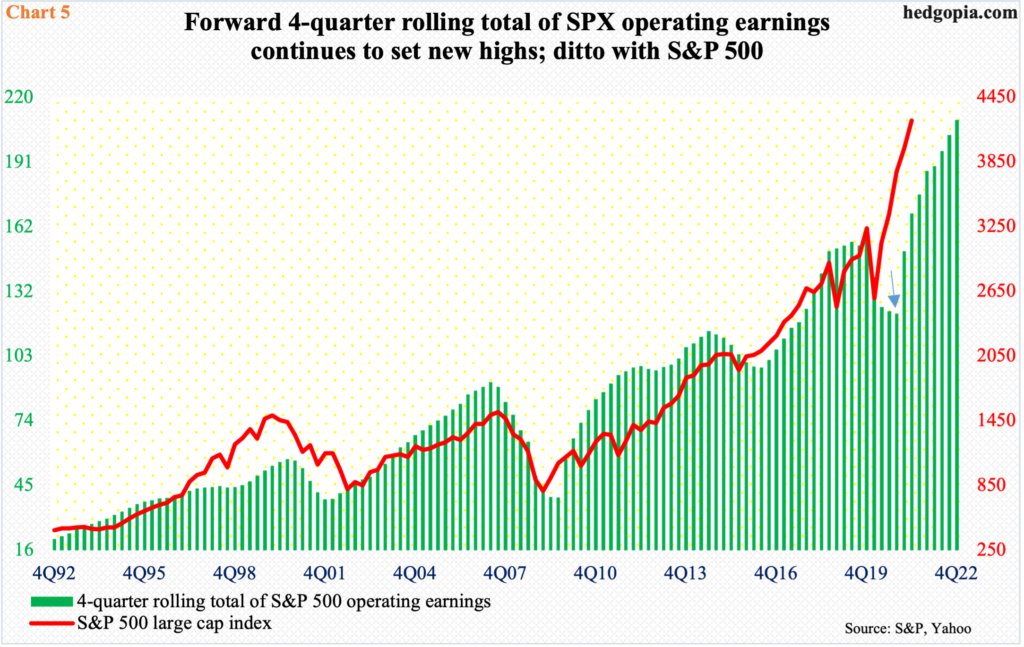
Then there is the issue of elevated earnings expectations, pricing in tons of good news. If large-caps are wishing for – and get – softer data, then this will have implications for earnings. As of last Wednesday, S&P 500 companies were expected to earn $209.52 in operations next year, up 12.3 percent from this year’s expected $186.53. Last year, they rang up $122.37.
As Chart 5 shows, the four-quarter total bottomed in 4Q20 (arrow). Only one of the next eight bars has passed, the rest are projections. For them to come true, the economy – not only US but global – should continue to hum along. Should this scenario come to pass, this will have raised risks of tapering, as Harker suggested last week. A catch-22.
Thanks for reading!
