
This week, Investors Intelligence bulls registered 60.4 percent. This was the highest since the week ended March 1 this year. Bears were 15.1 percent – the lowest since the week ended May 26, 2015.
Particularly post-presidential election last November, investor sentiment has persistently stayed bullish. In the 48 weeks since, only five had the bulls’ percent drop into the ’40s – that, too, high ’40s. The rest were 50 percent or higher, with 10 of them 60 percent or higher, including one this week.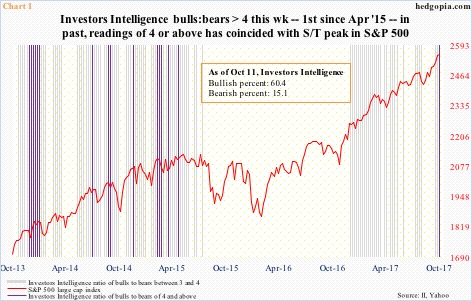
This week, bulls’ percent rose 2.9 percentage points week-over-week, even as bears’ dropped 1.9 percentage points, resulting in a ratio of four. This is rare.
Going back four years, there have only been 16 instances in which the ratio was four or above. Historically, even a ratio of three is not that frequent. But particularly since October 2013, three’s have occurred frequently.
In Chart 1, the grey bars represent readings between three and four, and the violet readings of four or above.
A pattern emerges in the chart.
At least going back four years, a reading of four or above has coincided with a short-term peak in the S&P 500 large cap index. Hence the question, will it be different this time?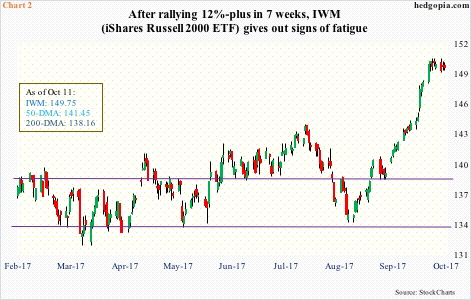
The S&P 500 remains grossly overbought, particularly on the daily chart. Although momentum is intact, with shorter-term moving averages still rising.
Elsewhere, some subtle signs of fatigue are showing up particularly on the Russell 2000 small cap index. On IWM (iShares Russell 2000 ETF), the last seven sessions have been marked by a hanging man, a spinning top and a couple of doji’s (Chart 2).
In a scenario in which small-caps begin to lag, there is plenty of room for the complacency built into the Investors Intelligence survey to unwind.
Thanks for reading!
