
Bulls just wasted a huge opportunity to squeeze non-commercial shorts in e-mini futures. This is coming at a time when the Fed’s balance sheet is no longer growing at a breakneck pace, which stocks cherished earlier.
Longs probably wasted a huge opportunity to squeeze shorts.
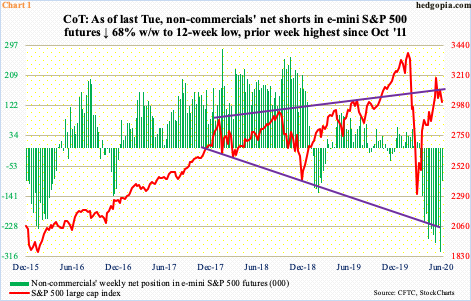
As of June 16th, non-commercials were net short 303,305 contracts in e-mini S&P 500 futures – the most since October 2011. As recently as the week to March 24th, these traders were net long – 12,688 contracts. The S&P 500, along with most major equity indices, bottomed on the 23rd. Non-commercials refused to jump on board. As a matter of fact, they kept adding to net shorts, culminating in 300,000-plus contracts by the 16th this month. A week later, that is by last Tuesday, they covered in a big way. Net shorts fell to 97,078 – a 12-week low (Chart 1). This was not a result of short squeeze. Last week, the S&P 500 fell 2.9 percent, and was essentially unchanged for the week through Tuesday.
Prior to last week’s massive reduction in net shorts, bulls were hoping to get help from short squeeze. Shorts did cover but failed to help the bulls. In fact, if not for shorts covering, selling could have been worse, come to think of it.
Non-commercials’ decision to cover is interesting considering the S&P 500 was beginning to weaken technically. One would think they would stay short, if not add.
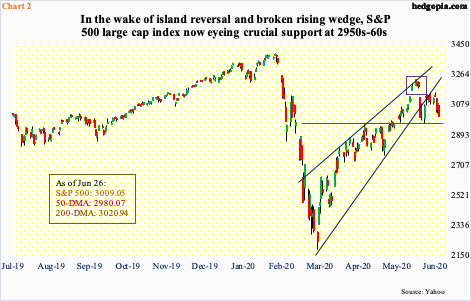
On June 11th, an island reversal formed on the index (violet box in Chart 2), which coincided with a breach of a rising wedge from the March 23rd low. This preceded a 47.5-percent surge from that bottom. That is a lot of paper profit in such a short span of time. Before selling could intensify, bulls defended 2950s shortly thereafter. Several rally attempts since saw sellers appear in the 3150 area, including last Tuesday. Subsequently, the S&P 500 (3009.05) lost both the 10- and 20-day moving averages. The 200-day (3020.94) was lost last Friday, although subtly.
A test of 2950s is probably just a matter of time. The 50-day at 2980.07 lies around there as well. It is possible non-commercials get active again once this support gives way.
Regardless how it shakes out in the weeks ahead, the latest reduction in non-commercials’ net shorts should be viewed as a wasted opportunity as far as bulls are concerned. This could have been as helpful as shorts elsewhere were.
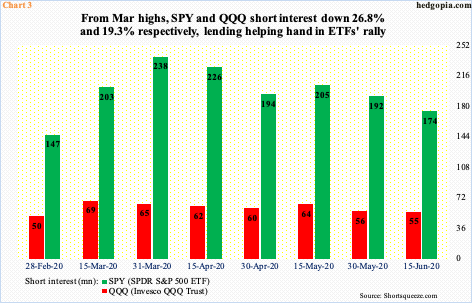
As selling intensified in March, short interest on SPY (SPDR S&P 500 ETF) and QQQ (Invesco QQQ Trust) jumped. By the middle and end of March respectively, QQQ’s reached 68.5 million shares and SPY’s 238.2 million. As these ETFs, and by default the indices they represent, rallied, shorts turned tail. By the middle of June, SPY’s was down 26.8 percent and QQQ’s 19.3 percent (Chart 3). Longs were lent a big helping hand by shorts.
The Nasdaq 100, in fact, went on to rally to a new – and newer – high. Along with the Nasdaq composite, the Nasdaq 100 is the only major index to have surpassed the prior high from February. Back then, the index peaked at 9736.57, which got taken out on the 4th this month.
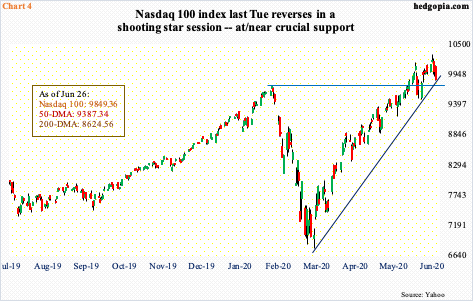
By last Tuesday, the index tagged 10306.90, although that high came in a shooting star session (Chart 4). It has had a phenomenal rally since March 23rd when it bottomed at 6771.91. On the weekly, in two of the last three weeks, the index produced candles with long shadows.
It is possible some level of distribution is taking place. The index ended last week right on its March trend line. Just underneath lies the prior high from February. Last Friday also breached the 20-day, albeit only slightly. This has not happened in the last two and a half months. Bears have an opening.
The advantage bears have is bulls’ inability to benefit on another front as well.
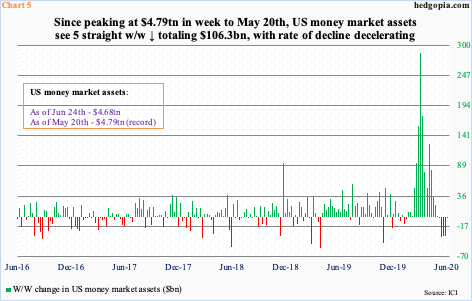
There is a lot of cash parked in money-market funds. In the week to May 20th, this swelled to $4.79 trillion – a record. From that high through last Wednesday, there have been five consecutive weeks of outflows, for a combined total of $106.3 billion (Chart 5).
That said, as per Lipper, during those five weeks, US-based equity funds bled $17.6 billion, while taxable bond funds took in $52.9 billion, investment-grade corporate funds $39.1 billion and high-yield funds $18.3 billion. The bottom line: stocks were unable to get their fair share even though money left money-market funds. A wasted opportunity as far as bulls are concerned.
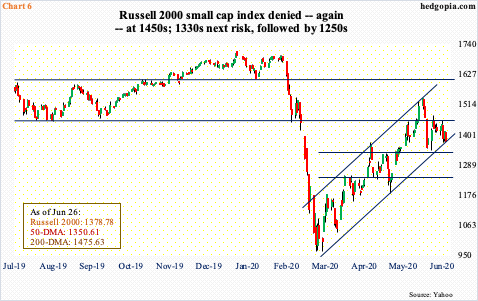
Speaking of opportunities, small-cap bulls, too, had an opportunity to take out 1450s, but to no avail. This level has proven to be an important price point for nearly three years now. In early March, momentum heavily swung bears’ way after 1450s gave way. The February-March collapse bottomed at 966.22 on March 18th. The subsequent rally peaked at 1537.62 on June 8th. To get there, the Russell 2000 small cap index (1378.78) obviously broke out of 1450s, but it was short-lived.
Last week, the attempt at 1450s was unsuccessful. This then quickly led to a test of channel support from the March bottom. Both Wednesday and Thursday, 1370s was bought; 1330s was not tested. This is the risk immediately ahead. A breach opens the door to a test of 1250s (Chart 6).
Small-cap bulls have for some time overlooked earnings deterioration. Now, with stocks having rallied massively off of the March low and earnings estimates continuing to unravel, they face a dilemma. How much currency should they give to next year’s estimates? Or, should they even completely give a cold shoulder to this year’s?
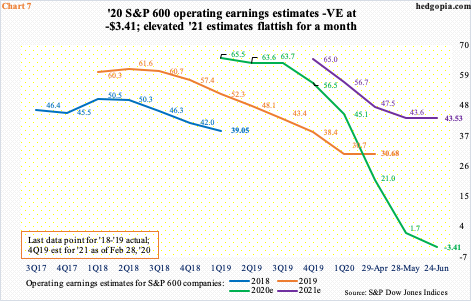
With half of the year gone, 2020 operating earnings estimates for S&P 600 companies just went negative. As of last Wednesday, these companies are now expected to lose $3.41 this year. This will be down from earnings of $30.68 last year and, more importantly, versus expectations of $67.63 in February last year (Chart 7).
For next year, however, the sell-side continues to wax enthusiastic, expecting $43.53 – down from $64.96 in February this year but hanging in there. For a month now, 2020 has gone sideways. It is anyone’s guess as to if, given the prevailing macro uncertainty, next year’s estimates can be taken at face value.
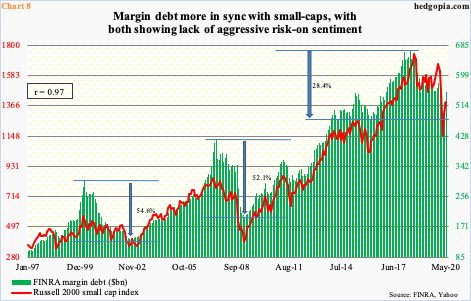
If small-cap bulls wholeheartedly bought into 2021 estimates, the Russell 2000 in all probability would have broken out of 1450s. Investors tend to gravitate toward small-caps when they are in a mood to take on risk. This is also true with margin debt. In fact, for a while now, FINRA margin debt has correlated more with the Russell 2000 than with the S&P 500.
Margin debt peaked in May 2018 at $668.9 billion. The Russell 2000 peaked in August that year. The S&P 500 has had its share of ups and downs, but it kept rising until February this year. Between January 1997 and May this year, the correlation coefficient between margin debt and the Russell 2000 was 0.97, versus 0.93 with the S&P 500.
The other thing is, in the prior two bear markets, from peak to trough, margin debt dropped in the 50 percent range. This time around, through March, it dropped 28.4 percent (Chart 8). In all probability, the February-March selloff in stocks prematurely stopped as the Fed stepped in.
On March 23rd, the very day major equity indices bottomed, the Fed announced an open quantitative easing (QE) and that it would now begin buying investment-grade corporate bonds, which was later expanded to junk.
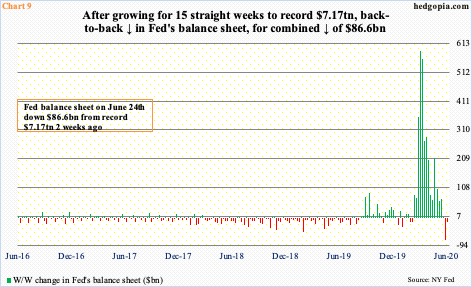
The balance sheet, which had already been growing, quickly expanded to $7.17 trillion, up from $4.18 trillion late February. The $3-trillion increase in less than four months peaked in the week to June 10th. In the next couple of weeks, it then dropped by $86.6 billion – $12.4 billion last week and $74.2 billion before that. In the week to March 25th, the balance sheet expanded by as much as $586.1 billion. The deceleration is evident in Chart 9. Incidentally, the S&P 500 peaked on June 8th, the same week the Fed’s balance sheet peaked. A tailwind for three months, it is now turning into a headwind. Bulls already have their work cut out having laid to waste an opportunity to squeeze shorts.
Thanks for reading!
