
- Post-October 15th reversal, equities have come too far too soon
- Sentiment less frothy, but in worse-case scenario has room to go a lot lower
- Having expended lots of energy past several sessions, bulls lack buying prowess for now
 Phew! Some ride! The past month or so, if there was one common theme in the financial markets, that would undoubtedly be volatility. From its September 19th intra-day peak of 2019, it only took the S&P 500 Large Cap Index 19 sessions to drop just shy of 10 percent. In the same time frame, the VIX surged from 11.52 to 31.06, and the 10-year yield dropped 76 basis points to 1.87 percent. On Wednesday a week ago in particular, things were out of this world. The 10-year had an intra-day swing of 30bps, the S&P 500 54 points, the Dow 458 points, the Nasdaq Composite 115 points, you get the picture. The October 15th reversal and since has been even crazier. One cannot even call this a V-bottom. It is narrower than that. In the next four sessions since that reversal, the S&P 500 closed up 6.7 percent, even as the VIX was nearly cut in half. And technicals are once again playing a role. The bounce/rally has paused/stopped at a predictable level. The major U.S. indices are at/near the 61.8-percent Fibonacci retracement of the recent decline. This is an ideal place for a pause.
As discussed on Monday, several indicators were flashing signals that such a bounce/rally might be on the horizon. Given how oversold they were/are there is still a lot more to go before these conditions are completely unwound. Seasonality of course is in favor of equities. Short interest remains high, and that can be a potential tailwind for the bulls. Yes to all that.
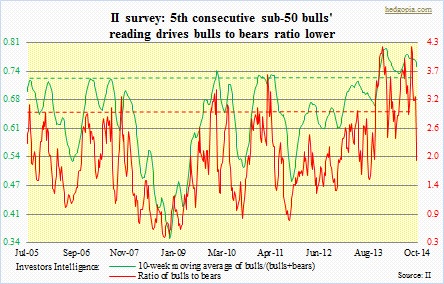
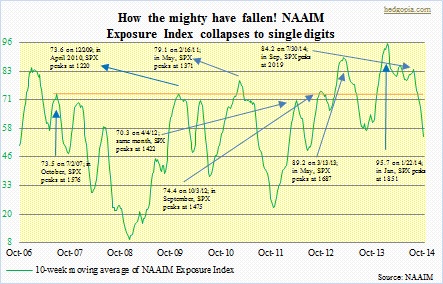 Now, here is a counter argument. In such a short amount of time, equities have come a long way. Of course, that preceded a drop of a bigger proportion. Bulls have managed to push the major U.S. indices past technically crucial levels. In the process they have expended lots of energy the past several sessions. This probably calls for a breather, which could mean imminent test of those levels. On the S&P 500 (1927), it lies at just north of 1900. This will give us one more data point as to how sustainable the latest bounce/rally is. Supply-demand dynamics will be put to a test. Yes, sentiment is less frothy versus when the selling began. For the fifth consecutive week, as per Investors Intelligence, bulls have had a sub-50 reading. From a contrarian perspective, this needs to go a lot lower; concurrently, bears’ reading – currently in the high teens – needs to go a lot higher. The 10-week moving average continues to stay elevated (chart on top). The NAAIM Exposure Index, however, has experienced a complete washout. This thing was over 100 late last year, and in the low 80s as early as September. Now, it is in high single digits. As shown, the 10-week moving average has dropped but in a worse-case scenario has room to go lower. Which is what took place in 2008, 2010 and 2011. Reason why a successful test of those aforementioned levels holds special significance now.
Between now and then, a short bias is probably the right way to go.
