
RVX is clinging on to support. A breakdown may help small-cap bulls near term, as the Russell 2000 itself is at/near resistance. That said, a ratio between the index and the S&P 500 just made a multi-year low.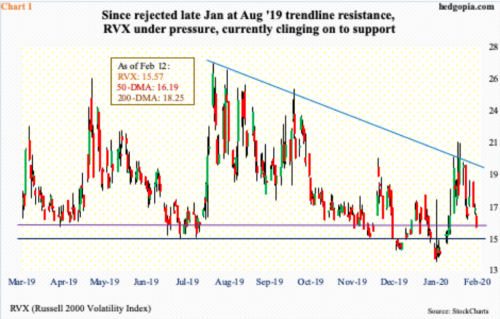
RVX, which measures market’s expectation of 30-day volatility derived from the prices of near-term Russell 2000 options, is approaching potentially important support. RVX is to the Russell 2000 small cap index what VIX is to the S&P 500 large cap index.
Last August, RVX spiked to 26.89 before retreating. A trend line drawn from that peak has consistently repelled rally attempts (Chart 1). In fact, the same trend line can be extended all the way back to December 2018 when the volatility index tagged 36.60 intraday and stocks put in a major low.
The latest rejection at that trend line came late January when on the 30th RVX (15.57) reversed after printing 21.46 intraday. Wednesday, it shed 1.22 points to slice through the 50-day moving average. The 200-day was lost six sessions ago.
The weekly has room to continue lower. The daily, however, is right at support. This is an opportunity for volatility bulls to put their foot down, otherwise should 14.80s break, bears would be eyeing 13, which was hit several times last month. After that comes 11-12.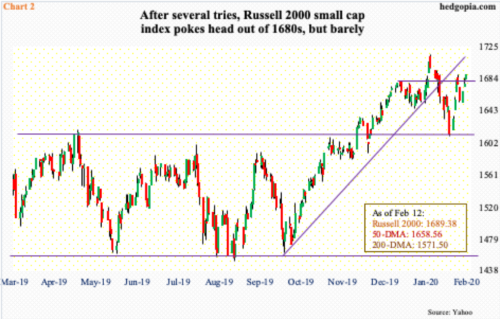
Should small-cap bulls be able to push RVX under the support zone identified in Chart 1, they will be in a good position to add to the recent momentum. This is because the Russell 2000 (1689.38) itself is at a crucial stage. As a matter of fact, the index Wednesday was able to poke its head out of horizontal resistance in the 1680s, which has acted as a ceiling going back a month and a half. Just above lies the January 17th intraday high of 1715.08. This is where the underside of a broken trend line from the lows of last October extends to (Chart 2). In the event that this roadblock gives way, bulls will be eyeing the all-time high of 1742.09 from August 2018.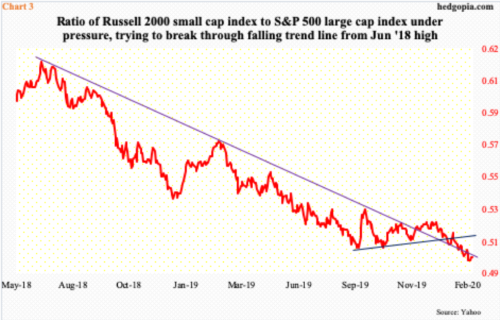
Amidst all this woulda-coulda-shoulda, one also needs to be aware of Chart 3, which presents a ratio of the Russell 2000 to the S&P 500. It has been in the midst of a serious downtrend since June 2018. Monday, the ratio hit 0.498, which is the lowest since August 2004. Wednesday, it ticked up to 0.5 – just under the trend line.
In fact, a couple of months ago, the ratio broke out, but was unable to build on it, before proceeding early this month to once again slip underneath. The thing is, even if the ratio breaks through in the sessions ahead, another resistance lies right above, which is a broken trend line from early September last year. The bottom line is small-cap bulls have their work cut out. A takeout of last month’s high on the Russell 2000 will not be easy, let alone the August 2018 high.
Thanks for reading!
