
Stocks continue to trudge higher. Volume is low and action listless. But price tells us otherwise. Amidst this, some divergences are showing up, and they are worth paying attention.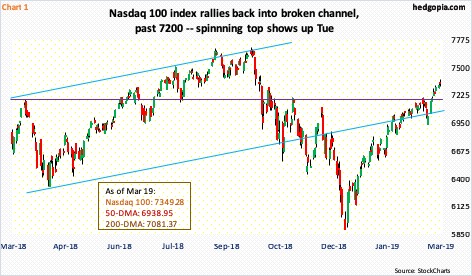
Equity bulls deserve kudos. Since the October-December decline last year, they have put up quite a show. From late-December lows, major US indices all rallied 20 percent or more. It has been a low-volume, consistent trudge higher.
Tech is leading, which from the perspective of risk-on sentiment, can be considered good. From the late-December low through Tuesday’s high, the Nasdaq 100 is up 25 percent. This compares with 21-percent increase for the S&P 500 large cap index and 20-percent rise for the Dow Industrials.
For most of last year, the Nasdaq 100 (7349.28) went back and forth within a rising channel, which it decisively fell out of in December. The index has rallied back into the channel, past crucial resistance at 7200 (Chart 1). Bulls need to defend this when the index comes under pressure, which may be near. Tuesday, a spinning top showed up right on the daily upper Bollinger band.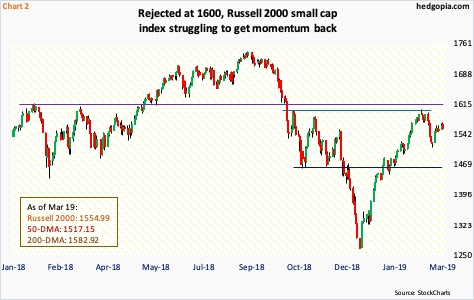
Small-caps are already acting weak.
The Russell 2000 small cap index (1554.99), which at one point in time led the action, is now beginning to diverge. From the late-December low through February 25, the index led its peers with a jump of well over 26 percent; then, it got rejected at 1600-plus. This resistance goes back to January 2018 (Chart 2).
The Russell 2000 is still up nearly 23 percent from late December, but since that rejection it has been a laggard. Currently, it is stuck between its 50-day (1517.15) and 200-day (1582.92). All other major indices are above these averages.
Like tech, small-caps reflect traders’ willingness to take on risk, and on this score the evidence is mixed, with tech leading and small-caps lagging.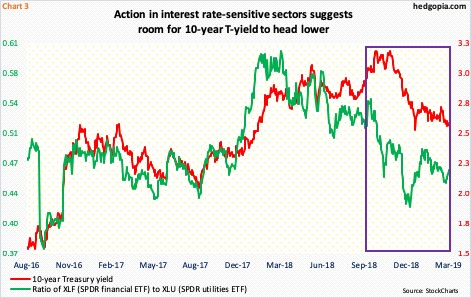
Other divergences are beginning to show up as well.
Chart 3 plots a ratio of XLF (SPDR financial ETF) to XLU (SPDR utilities ETF) against the 10-year Treasury yield. Utilities are highly interest rate sensitive. The 10-year (2.61 percent) peaked at 3.25 percent early October, before dropping all the way to 2.55 percent early January. Turns out that was a false breakdown as the 10-year immediately rallied back above 2.62 percent, where support goes back a decade. That said, yields have essentially gone sideways since then, during which XLU (57.31) rallied to a new high of 58.74 on March 14. During all this, the ratio last December dropped to as low as 0.424, which was the lowest since November 2016. The 10-year yielded sub two percent back then. The fact that it held up this time around could very well be due to that support at 2.62 percent. Bond bears cannot afford to lose this, but if the ratio is sending the right message and the 10-year breaks down, it could eventually be headed toward two percent.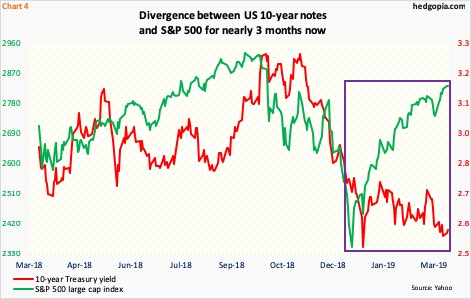
This can have repercussions for a whole host of assets across markets.
Stocks bottomed late December – the S&P 500 (2832.57) on December 26. The index has had quite a rally since, recapturing one after another resistance. It just rallied past major resistance at 2800-plus, but – once again – there is not much conviction in the move. There was a mini-reversal Tuesday, as the index rallied to 2852.42 but only to close flat. Weekly and daily conditions are grossly extended. Too soon to say if bears can build this into something, but ingredients are there. Throughout the nearly-three-month rally, the S&P 500 has diverged with the 10-year (Chart 4).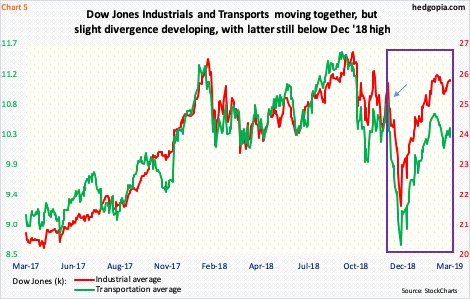
Speaking of which there are similar dynamics in play between the Dow Jones Industrial average (25887.38) and the Transportation average (10277.32). Directionally, they are still moving together. But a deeper look reveals that the latter is well below its early-December high, while the former is testing it (arrow in Chart 5). Back then, as soon the month began, the bottom fell out of stocks. It is therefore an important price point.
The two indices have diverged for a month now, and both recently made lower highs. The lows from early this month have now taken on significance – 25208 on the Industrials and 9994.09 on the Transports. A breach of these levels will establish a pattern of lower highs, lower lows. At a time of when there are several other divergences elsewhere, they are worth watching.
Thanks for reading!
