
Major US equity indices declined for the second week in a row. The S&P 500 breached the 50-day last week, albeit slightly. Interestingly, both VIX and small-caps diverged. This is taking place at a time when the FOMC is meeting this week amidst some softening in data including jobs and consumer inflation.
The S&P 500 has suffered its first back-to-back weekly drop since May. From its September 2 all-time high of 4546, the large cap index is now down 2.5 percent.
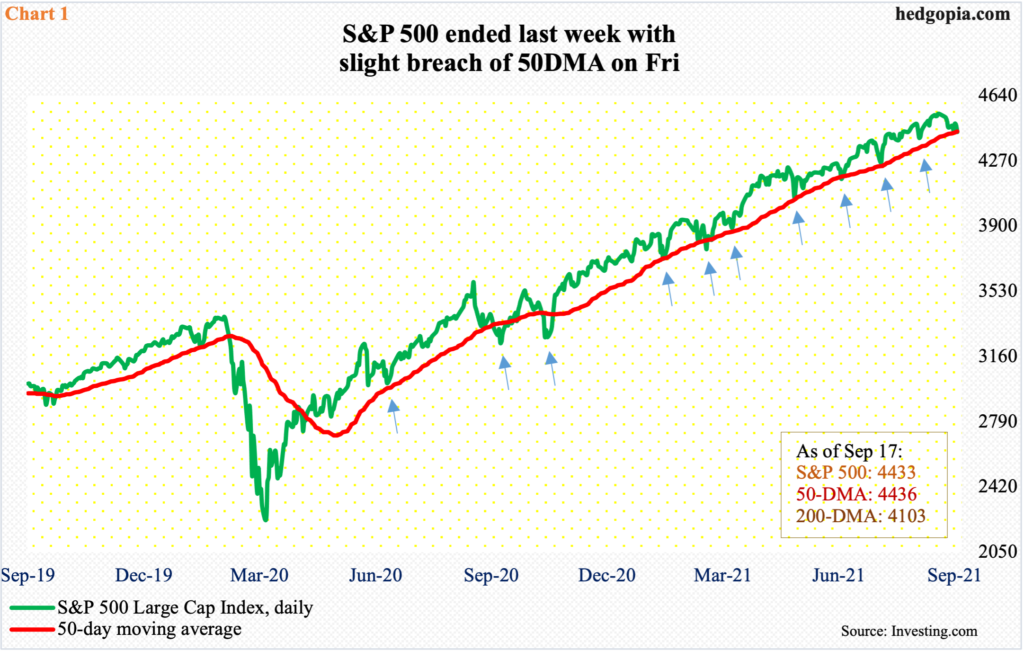
Last week, it went back and forth between the 20- and 50-day moving averages in the first four sessions before slightly breaching the latter on Friday – with the index closing at 4433 and the 50-day at 4436.
From May last year, this was the 11th test of the 50-day. The prior 10 were successful (Chart 1). Bulls can still salvage the situation. In September and October last year, the index remained under the average for several sessions before reclaiming it.
On September 2 when the index reached a new high, it tagged the daily upper Bollinger band. Last Friday, the low of the session tagged the lower band. Bulls hope this acts as support. Slightly underneath, there is another layer of support at 4360s.
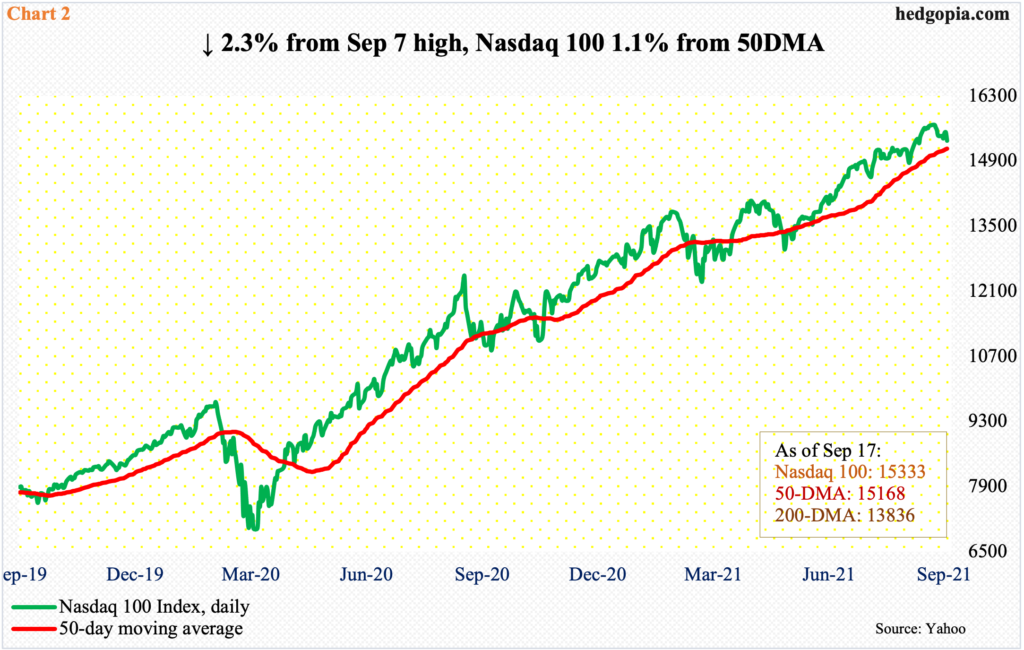
On the Nasdaq 100, the 50-day is 1.1 percent away (Chart 2). It, too, suffered a back-to-back drop last week, down 2.3 percent from its September 7 all-time high of 15701.
Last week, tech bulls refused to give away the 20-day in the first four sessions but were unable to save it on Friday as selling intensified.
The weakness preceded inability to push through 15700 for several sessions.
The 50-day also approximates horizontal support at 15100s.
As stocks – primarily large-caps – came under pressure last week, there were a couple of interesting divergences.
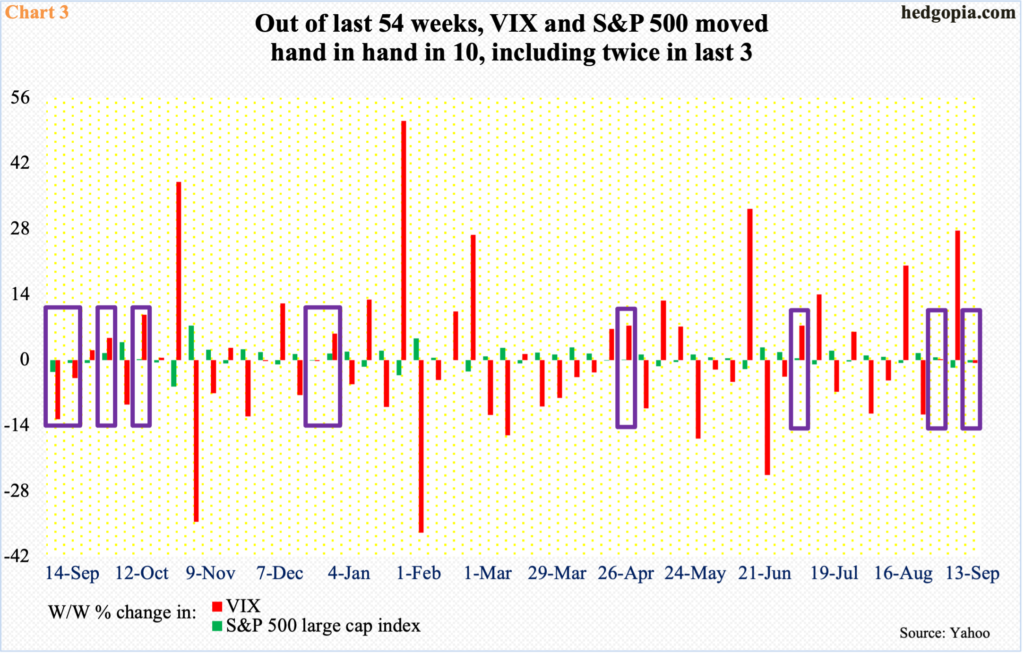
VIX, which is derived from the prices of S&P 500 index options, is a measure of market estimate of 30-day volatility. Ordinarily, the two tend to move in opposite direction. Last week was one of those rare moments when they moved in unison, with the volatility index down 0.7 percent and the S&P 500 down 0.6 percent.
In fact, last week’s positive correlation was the second such occurrence in the last three. This makes up only the 10th time this has happened in the last 54 weeks (Chart 3).
This is taking place at a time when VIX’s monthly chart is itching to rally. So far in September, it is up 4.3 points to 20.81.
In the first four sessions last week, VIX had difficulty staying above the 200-day. On Monday-Thursday, it kept closing under the average (19.98) but at the same time the 50-day at 17.86 provided support. Come Friday, the 200-day was reclaimed, with a session high of 21.51.
As things stand, the daily seems to want to rally further. The next resistance lies at 25.
The other divergence came from small-caps. The Russell 2000 bucked the trend last week by rallying 0.4 percent.
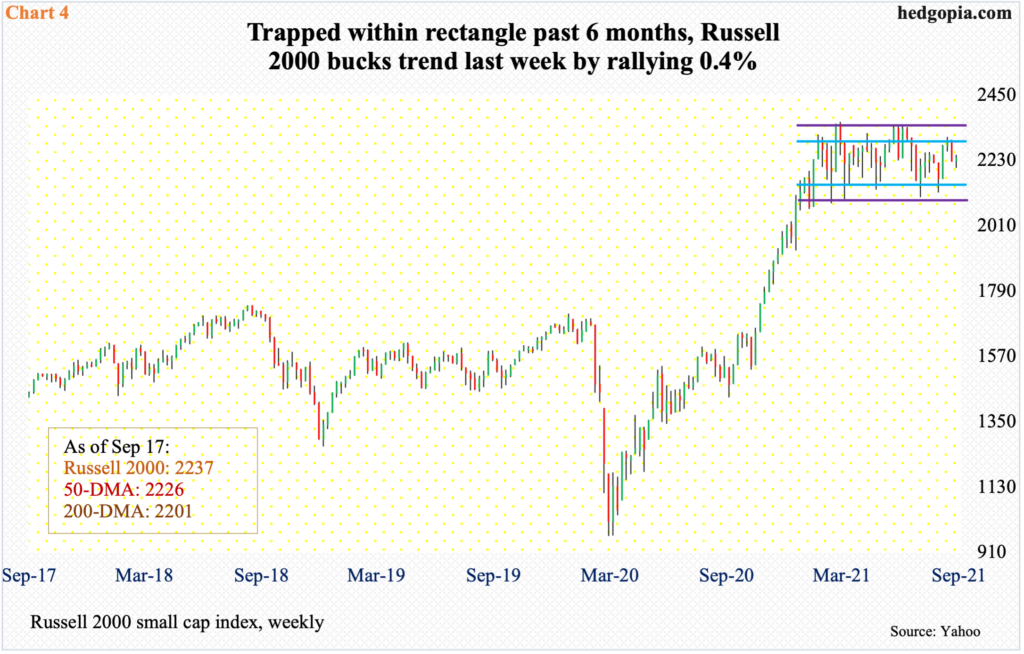
The small cap index (2237) continued to trade around its 50-day (2226), which has been flattish the past six months. The average began to go sideways after the Russell 2000 posted a new all-time high of 2360 on March 15. This preceded a one-year, 144-percent surge.
Bulls obviously hope the six-month consolidation resolves to the upside. The index has played ping pong between 2350s and 2080s. Within this rectangle lies another range between 2280s and 2150s (Chart 4).
Ordinarily, small-caps tend to be risk-on. It is possible traders were positioning themselves for a rally this week post-FOMC decision. The two-day meeting ends on Wednesday.
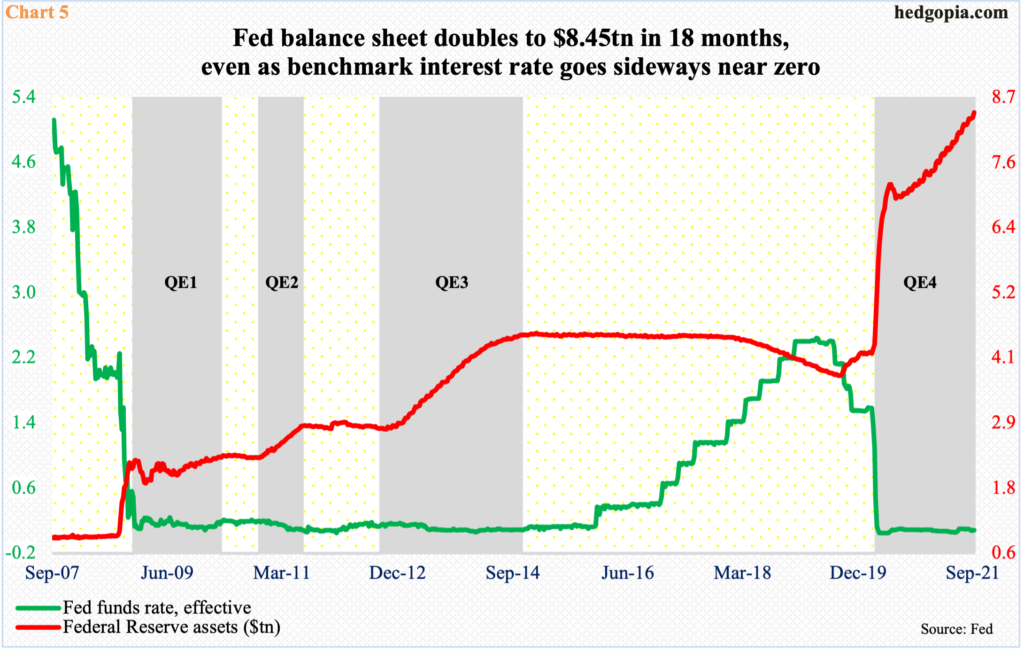
At the Jackson Hole symposium late last month, Federal Reserve Chair Jerome Powell indicated that the central bank would begin to taper its bond purchases toward the end of the year. Currently, the Fed buys up to $80 billion in treasury notes and bonds and $40 billion in mortgage-backed securities every month. It is sitting on $8.45 trillion in assets, twice what it held in early March last year.
Post-Jackson Hole, several data points are pointing to deceleration in the economy, with August’s jobs report and consumer inflation both coming in weaker than expected. FOMC doves can use this to argue for a delay in tapering. In this scenario, equities’ immediate post-meeting reaction could be up. But the fact remains that tapering is coming sooner than later.
The Fed has remained ultra-easy for too long (Chart 5). Benchmark rates are zero-bound, and they should remain that way. On the balance sheet front, however, the central bank will increasingly come under pressure to begin to unwind. Reduced liquidity can begin to weigh on investor sentiment.
Thanks for reading!
