
Markets are under the influence of the Fed’s rate hike talk – or a lack of it – a little too much … to such an extent that it can potentially backfire someday.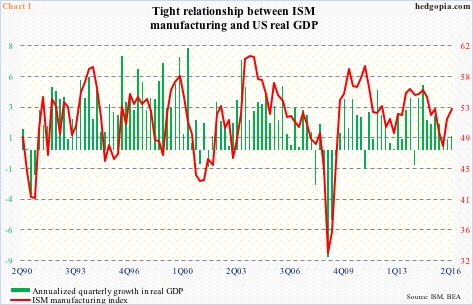
Last Thursday, we learned that the ISM manufacturing index for August contracted 3.2 points month-over-month to 49.4 – a seven-month low. Orders dropped 7.8 points m/m to 49.1 – first sub-50 reading since December last year.
This was the first sub-50 reading in the main index since February this year and in orders since December last year. U.S. stocks reacted initially by selling off, with the S&P 500 large cap index losing 0.6 percent at one time but managing to close flat.
The weak ISM report was apparently taken to mean that the Fed would find it hard to hike come September 20-21. ISM does tend to correlate with GDP (Chart 1). A day later, on Friday, investor reaction was similar.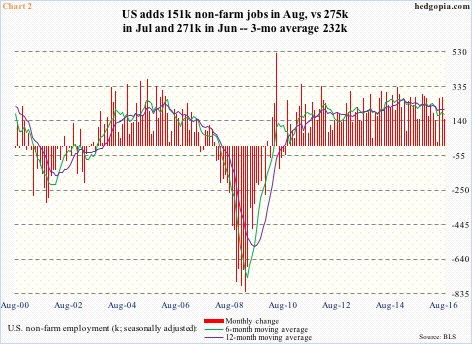
August produced a below-consensus 151,000 non-farm jobs, following 275,000 in July and 271,000 in June. Pre-open, futures were flat, but rallied as soon as the report hit the tape. The session saw the S&P 500 rallying 0.4 percent. Once again, the premise behind investor reaction was the same – that the report was weak enough it would discourage the Fed from moving.
Janet Yellen, Fed chair, places a lot of emphasis on jobs. The August report was weak versus July and June but a lot stronger versus May’s anemic 24,000 jobs. The monthly average in the past three months was 232,000 and 182,000 year-to-date – nothing to sneeze at. If the FOMC cannot hike on this report, it will probably be a long time before we see one – essentially a green light for continued buildup in excesses.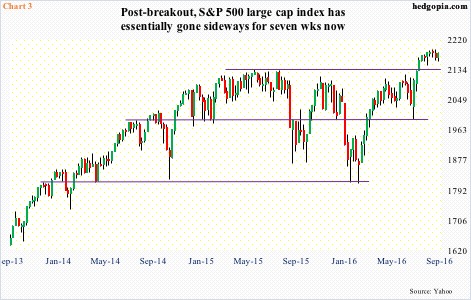
That is precisely what stocks are betting on. Last week, the S&P 500 rallied 0.5 percent, and has essentially gone sideways in the past seven (Chart 3). The sideways action follows a breakout to a new high two months ago – potentially an important breakout technically but the fundamental ground it is built on is unsteady.
Traditionally, low rates would help spur economic activity, and stocks would begin to discount that ahead of time. This cycle has proven to be different. Rates have been zero-bound since December 2008 (Chart 5). In December last year, for the first time in over nine years, the fed funds rate was pushed up by 25 basis points to a range of 0.25 percent to 0.5 percent.
What have these low rates brought?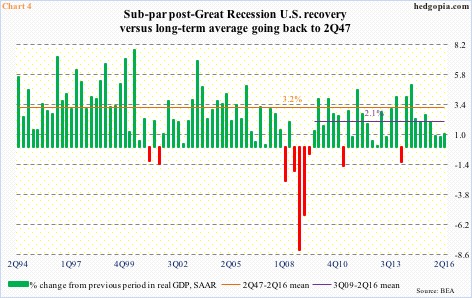
From 2Q47 to 2Q09, when Great Recession ended, real GDP grew at an average of of 3.4 percent. Beginning 3Q09 through 2Q16, the growth rate decelerated to 2.1 percent. The post-Great Recession slowdown has pulled down the long-term average to 3.2 percent (Chart 4).
Real GDP grew an annualized 1.1 percent in 2Q16, following 0.8 percent in 1Q16 and 0.9 percent in 4Q15. As of last Friday, the Atlanta Fed’s GDPNow forecast is modeling 3.5 percent growth in 3Q16. This would be the first north-of-three-percent quarter since 3Q14.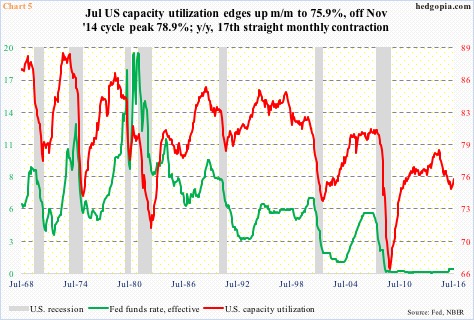
Capacity utilization peaked at 78.9 percent in the current cycle. At least going back five decades, this was the first recovery in which utilization did not cross 80 percent before coming under pressure. Utilization dropped to 74.9 percent in March this year, rising to 75.9 percent by July.
What jumps out in Chart 5 is the green line failing to follow the red line higher in the current cycle, and that the latter peaked even as the former has been left suppressed at the zero-bound. Low rates have proven not to be a panacea. Nor did they succeed in preventing earnings from peaking.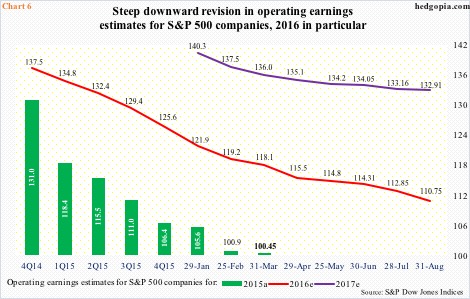
Corporate profits adjusted for inventory and depreciation peaked at a seasonally adjusted annual rate of $2.22 trillion in 4Q14; 2Q16 was $2 trillion.
Along the same lines, operating earnings estimates for S&P 500 companies have come under massive downward revision. These companies earned $113.02 in 2014. In 2Q14, 2015 was expected to earn $137.50; when it was all said and done, the year earned $100.45. In 4Q14, 2016 estimates were $137.50, which have now been cut to $110.75. Similarly, in January this year, 2017 started out at $141.11, now revised to $132.91. Once again, low rates have failed to be a cure-all insofar as earnings are concerned.
Logically, and based on history, stocks should be reflecting this. But they have diverged.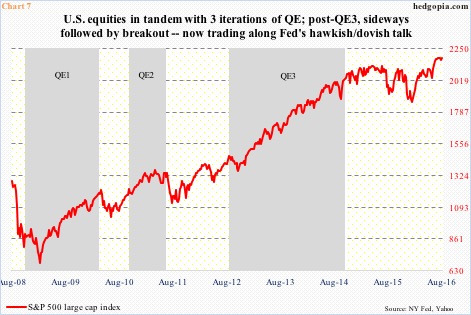
Back in November 2008 when the Fed initiated quantitative easing, stocks were in the midst of a bear market. The S&P 500 had an important bottom that month, followed by a generational bottom in March 2009.
Stocks pretty much followed the beginning and end of three iterations of QE (Chart 7). After QE3 ended in October 2014, the S&P 500 went sideways, peaked in May 2015, finally breaking out of the year-and-a-half range this July.
Of late, prominent FOMC members have expressed their desire to hike, should economic data cooperate. Hence the rally in stocks in the past couple of sessions in the wake of weaker-than-expected ISM and jobs reports.
This only helps give rise to distortions and excesses.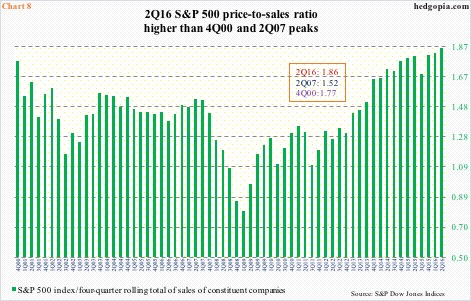
On a trailing 12-month basis, the S&P 500 trades at north of 21 times operating earnings – the highest since 3Q09 (not shown here). Also on a trailing 12-month basis, the price-to-sales ratio in 2Q16 stood at 1.86, higher than 1.77 in 4Q00 and 1.52 in 2Q07. Companies massage their earnings using a whole host of ways, not the least of which is buybacks.
Sales are sales. There is no manipulating the top line. In normal circumstances, markets would probably pay a lot of heed to the dangerously rising green bars in Chart 8. As they probably would to lagging transports, crude, and small-caps – all three key indicators. But not this time. It is the Fed – not fundamentals – that is guiding investing decisions. A recipe for backfire someday.
Thanks for reading!
