- Rather quick deterioration in momentum in U.S. stocks
- From sentiment to Greece to $, worrywarts have plenty of things to worry about
- Next couple of days will be crucial for bulls to step in and try not to let things get out of hand
With the painful session yesterday, the next couple of days are bound to be crucial. If selling does not stop soon, weekly technicals, which are overbought, will begin to come under pressure. And unwinding those will take longer.
The concern for the bulls is that momentum has deteriorated. Rather quickly. Bearish MACD crossover is widespread on a daily basis. The S&P 500 Large Cap Index, the Dow, the Nasdaq Composite (by default, QQQ and XLK) and industrials (XLI) have convincingly lost their respective 50-day moving averages. Like that! The NYSE Composite and materials (XLK) have lost the 200-day. Healthcare (XLV) and financials (XLF) are literally sitting on the 50-day, even as consumer staples (XLP) is not that far away.
The biggest tell in all this? On a day WTI crude was down five-plus percent, transports were not able to save the 50-day. A case of throwing the baby out with the bathwater? Well, the popular narrative so far is that the drop in oil is a big plus for the consumer, which undeniably it is. But this is the positive aspect in the equation. The negative aspect is employment/earnings/capex repercussions. One wonders if the majority is now beginning to focus on the ‘cons’ as well as the ‘pros’
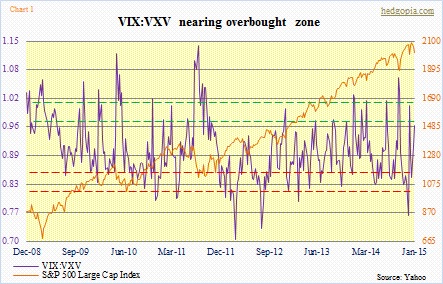
The consolation in yesterday’s session is how the Russell 2000 Small Cap Index acted the whole day. It was down all right, but held up better all day. The VIX to VXV ratio is close to getting overbought (Chart 1), and that could potentially bring buyers out of the woodwork. Nonetheless in early October this ratio went on to overshoot by quite a bit. The VIX has surged 37 percent in five sessions, and it is probably time to keep eyes and ears open for a spike/reversal sequence.
But it has not happened yet.
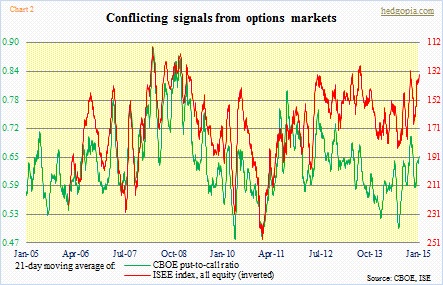
There are some interesting signals coming out of the options markets as well. The ISEE index (all equity) is nearing a level that marked the bottom in stocks mid-October (Chart 2). This is a call-to-put ratio, hence inverted in the chart. The CBOE put-to-call ratio (21DMA) has room to rise further before it flashes such a signal.
These are things to monitor.
As things stand now, the most important thing to consider perhaps is what may have led to the sell-off and if and when they would reverse.
First of all, going back to 2008, December was an up month for stocks in general every year except 2014. Investors have been conditioned to expect an up December. And we saw that in fund flows. U.S. stocks attracted $39bn in the week ended December 24th, the biggest since Lipper began collecting data in 1992. This was also evident in the NAAIM Exposure Index, which rose to an 11-month high by the end of December. Goldman’s sentiment indicator showed a similar euphoric reading.
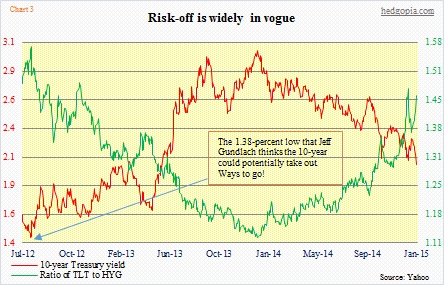
Secondly, Greece is front-and-center. And the parties concerned are playing the mind game. Syriza, the likely winner (going by the polls) in the upcoming January 25th elections, would like to stay in the Eurozone but with the aim of renegotiating the terms of a 2012 bailout agreement. Germany, on the other hand, is trying to scare the Greeks not to vote for Syriza. Mid-afternoon yesterday, I heard an analyst rhetorically ask on radio, “Could Greece be Europe’s Lehman Brothers?” Far-fetched? Perhaps. But people are now beginning to toy with various scenarios. This creates uncertainty. What do investors do in times like these? Pile into bonds, of course (Chart 3). (Not to mention Jeff Gundlach’s comments in the latest issue of Barron’s that the 10-year could potentially take out the mid-2012 low of 1.38 percent.)
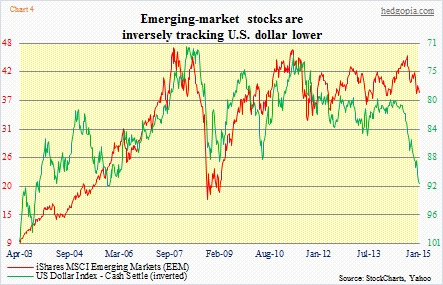
Last but not the least is the U.S. dollar. It has been on a tear. Has momentum. Does not want to even take a breather regardless how overbought this thing is. How are commodities going to bottom until this freight train stops? Chart 4 shows the correlation the buck has with stocks in emerging markets. Unnervingly, the longer dollar strength persists, the higher the odds of accidents in emerging markets. Welcome to the world of the unwinding of carry trade.
Combine all these factors, and worrywarts probably get strong enough reason to at least stay on the sidelines. For now. Inflows into U.S. stocks were so strong two weeks ago, it is hard to imagine a repeat of that feat anytime soon. There are nearly three more weeks until the elections, so Greece will continue to be in the headlines. And God only knows what the dollar will do should the FOMC later this month send strong signals that a rate hike is on the way.

