
Medium- to long-term, Fed pivot-yearning equity bulls could be setting themselves up for disappointment given the Fed’s resolve to keep rates higher for longer and the trajectory of the US economy and/or corporate earnings. Near-term, in an FOMC week, a rally is possible, with help from reduced volatility.
US tech for the most part did not disappoint last week, as stocks of the major tech outfits reporting their March quarter drew positive reaction post-earnings. Microsoft (MSFT), Google parent Alphabet (GOOG) and Facebook parent Meta Platforms (META) were up for the week, while Amazon (AMZN) was down.
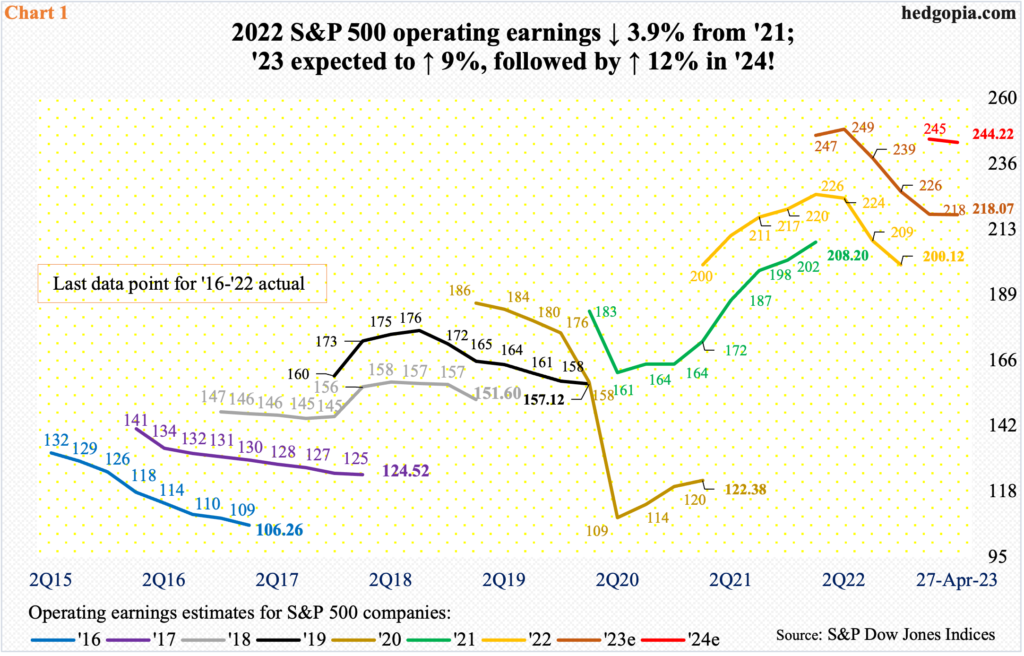
With just under 64 percent of S&P 500 companies having reported thus far, 1Q blended operating earnings have come in at $51.03. When the quarter started – or when 4Q22 ended – the sell-side expected $53.36. Lower earnings bar has obviously helped the companies to meet and/or beat expectations.
Amidst this, the mystery continues to swirl around 2023 and 2024 estimates. In April, both years slightly edged lower from March – from $218.38 to $218.07 and from $245.35 to $244.22, in that order (Chart 1). If these estimates come in as expected, 2023 would have grown nine percent over last year’s $196.95, followed by another 12 percent growth in 2024.
In normal times, this should not be that big of a deal in a growing economy. But that is not the case here.
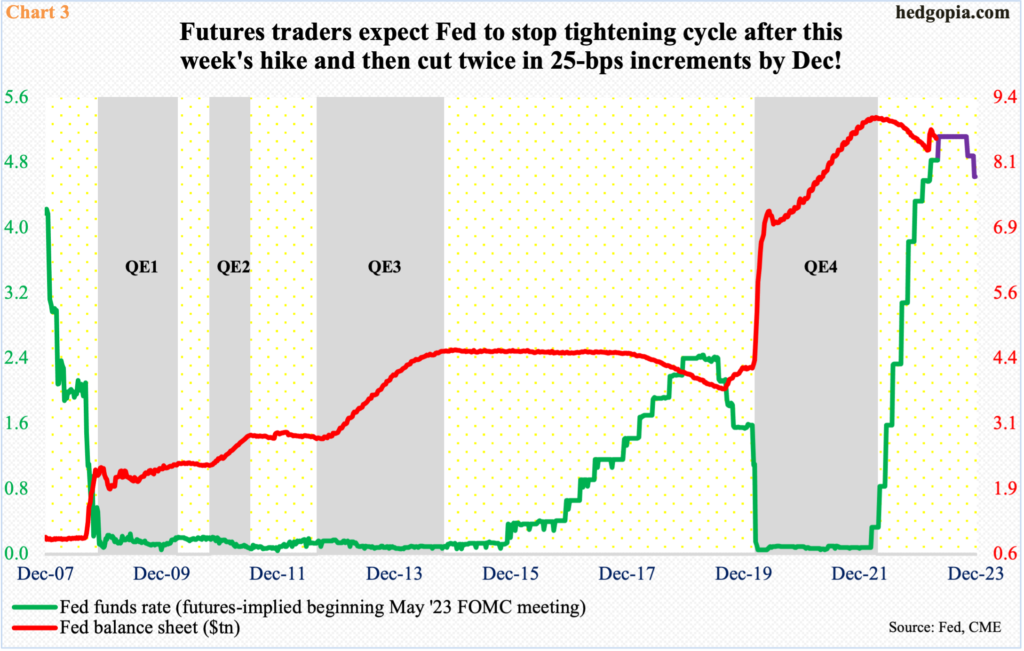
The FOMC meets this week, and they are expected to raise by 25 basis points. With this, the fed funds rate will have reached a range of 500 basis points to 525 basis points. In March last year, the benchmark rates were languishing at zero to 25 basis points.
The question is if the US economy has already factored in the 500-basis-point increase or it is still work in progress. Given the speed by which the rates have gone up, odds favor there is more filtering-through yet to come.
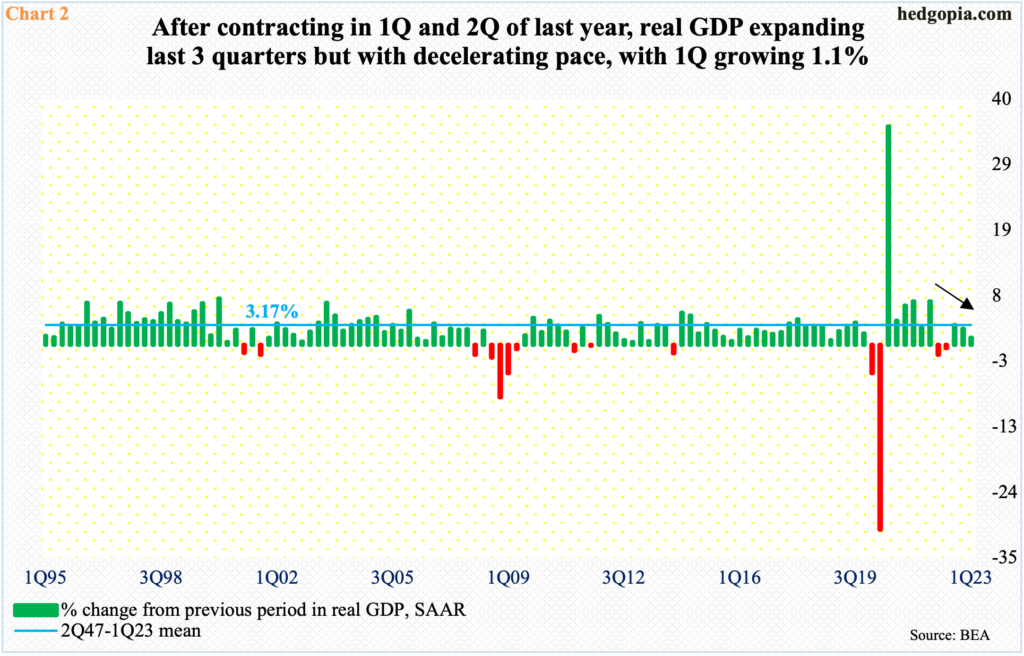
The economy is already trending lower. The advance estimate showed real GDP grew 1.1 percent in 1Q23. This represents decent deceleration from growth of 2.6 percent and 3.2 percent in 4Q and 3Q of last year, in that order. This was preceded by contraction of 0.6 percent in 2Q and 1.6 percent before that in 1Q (Chart 2).
Given where things are, it is safe to assume that the economy faces serious deceleration at best and a recession at worst in the quarters ahead. This is particularly so given that the Federal Reserve wants to leave rates higher for longer. Their hands are tied with inflation trending lower from last year’s multi-decade highs but remaining much above their two percent goal.
The March-meeting FOMC dot plot expected a terminal rate of 5.1 percent, which is where the fed funds rate will have reached after this week’s hike. A pause hence is probable, with a likelihood that the Fed emphasizes on date dependency, which will mean the upcoming CPI (consumer price index) and PCE (personal consumption expenditures) releases will decide if there will be another hike in June.
More importantly, markets currently expect the Fed to begin to cut as early as either September or November, ending the year with two 25-basis-point cuts to a range of 450 basis points to 475 basis points. The central bank is unlikely to go along with these demands.
In a scenario in which the Fed’s hands will be forced to pivot right away and begin to ease, the economy will have to be in a very bad shape, which will have drastically dragged down earnings to begin with. Either scenario is not friendly to risk-on.
Going into this week’s FOMC meeting, equity bulls were in a mood to take on risk.
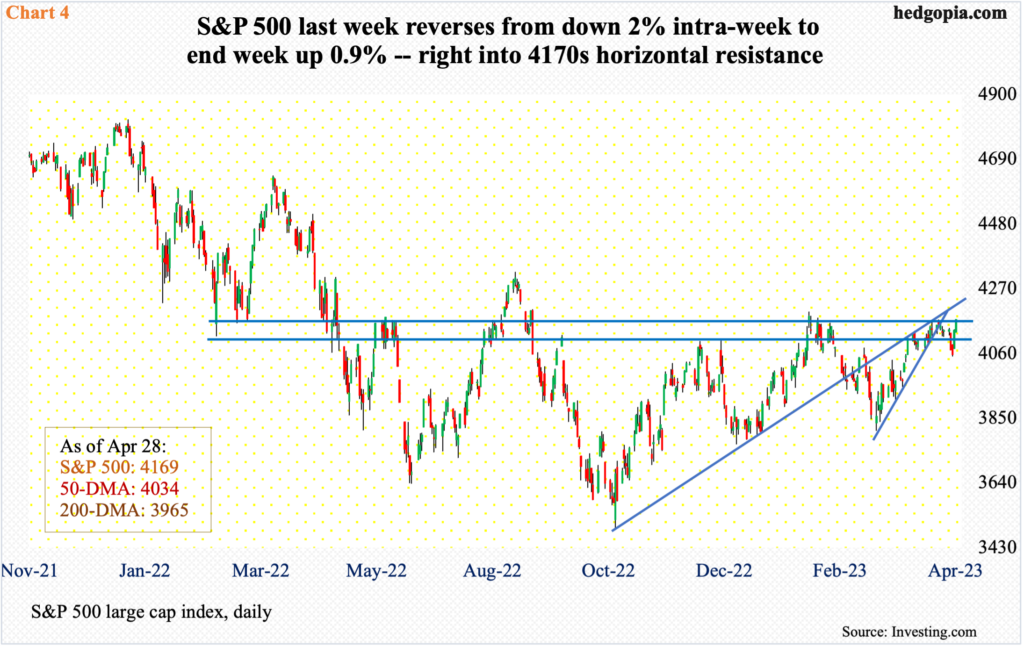
In fact, until Wednesday’s low of 4049, the S&P 500 was down two percent for the week. Then things reversed, producing back-to-back bullish marubozu candles on Thursday and Friday, ending the week up 0.9 percent to 4169.
Interestingly, last week’s weekly candle can be interpreted both bullishly and bearishly, depending on one’s bias. Time will tell if it is a hanging man (bearish) or a hammer (bullish). The S&P 500 has been in an uptrend since last October’s low, so it is possible it is a hanging man. Last week was preceded by two weekly dojis over three weeks; the index did close right into 4170s resistance last week (Chart 4). But it is also an FOMC week, not to mention the fact that Apple (AAPL) reports Thursday. A dovish FOMC message – real or perceived – can change investor sentiment very quickly.
Right here and now, VIX could end of helping equity bulls near term.
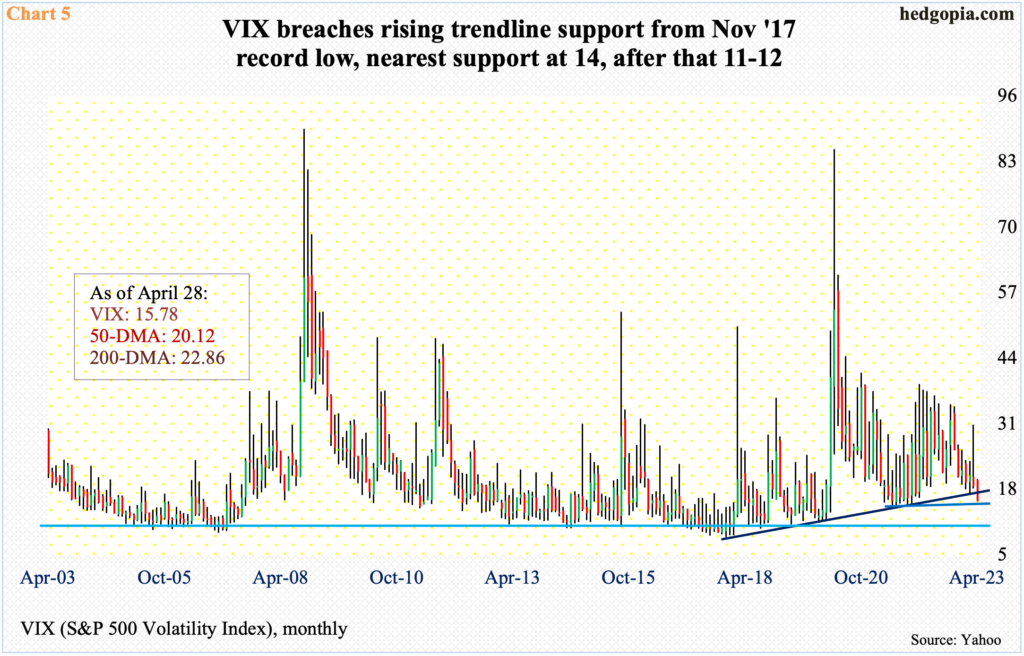
The volatility index last week dropped 0.99 points week-over-week to 15.78, which was the lowest print since November 2021. In April, VIX also breached a rising trendline from November 2017 when it reached an all-time low of 8.56 (Chart 5).
There is decent straight-line support at low- to high-14s. If that goes, major support lies at 11-12.
Thanks for reading!
