
If the overnight strength in the futures market sticks and Tuesday’s CPI report cooperates, there is room for continued rally in stocks. Some indicators such as the percent of S&P 500 stocks above the 50-day are way suppressed, although the metric is yet to reach a washout low.
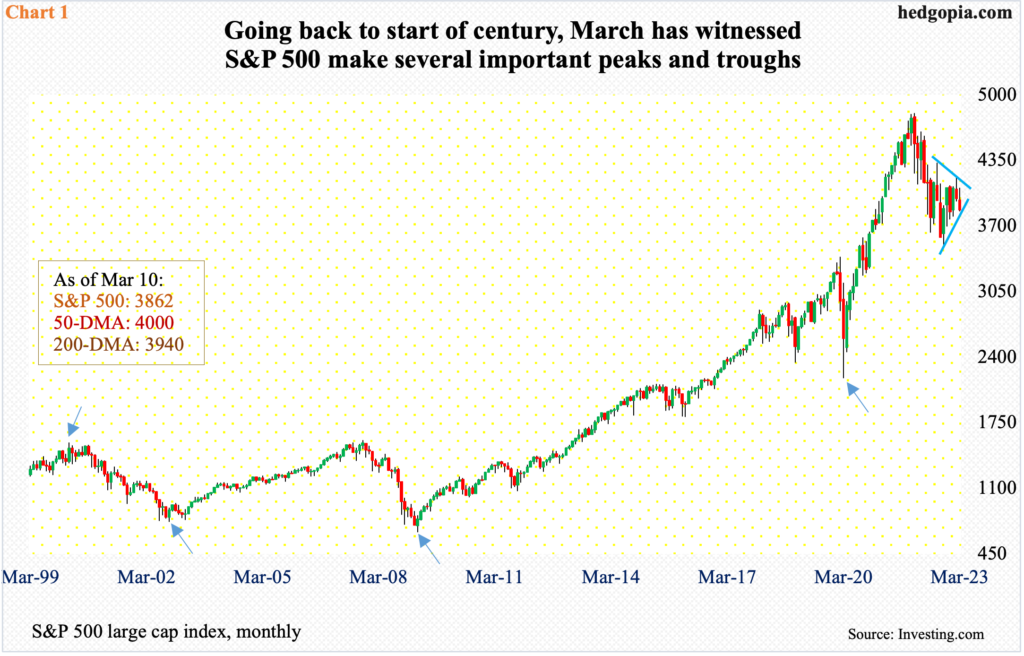
Several times in the past, March has proven to be a crucial month – both from the perspective of peak and trough.
In 2000, the dot-com bubble burst in that month, with the S&P 500 ticking 1553 on the 24th; in the next three weeks, it promptly fell just short of 14 percent. By September 1, the large cap index was back at testing the March high, ticking 1530, before double-topping. The resultant bear market would not bottom until March of 2003; in fact, the absolute low of 769 was reached on October 1, 2002, followed by 789 in March the following year, before the index took off.
During the 2008-2009 financial crisis, the S&P 500 peaked in October 2007, but it did trough in March of 2009, with the index touching 667 on the 6th. Then in 2000, post-Covid bear market, it was again March when the index bottomed at 2192 on the 23rd.
March this year has been volatile. Until the 6th, the S&P 500 was up 2.7 percent for the month. By last Friday, it was down 2.7 percent. After rallying just north of 20 percent from last October’s low, the index reversed on February 2 at 4195. A falling trend line from that high drew sellers in droves last Monday when the index retreated at 4078, forming a spinning top. By last Friday, 3846 was tagged intraday, with a close of 3862.
The daily is oversold, so a rally is possible in the right circumstances. At the time of writing this, the government’s attempt to stabilize the Silicon Valley Bank situation has equity bulls aggressively bidding up futures. The 200-day moving average lies at 3940, and that will be a place where the bears will try to make their presence felt. After that lies 4100, which has been a level of interest for both bulls and bears going back a couple of years. Incidentally, this is where the top end of a pennant lies (Chart 1); a breakout occurs at 4100. As of last Friday, the index was close to breaking on the downside.
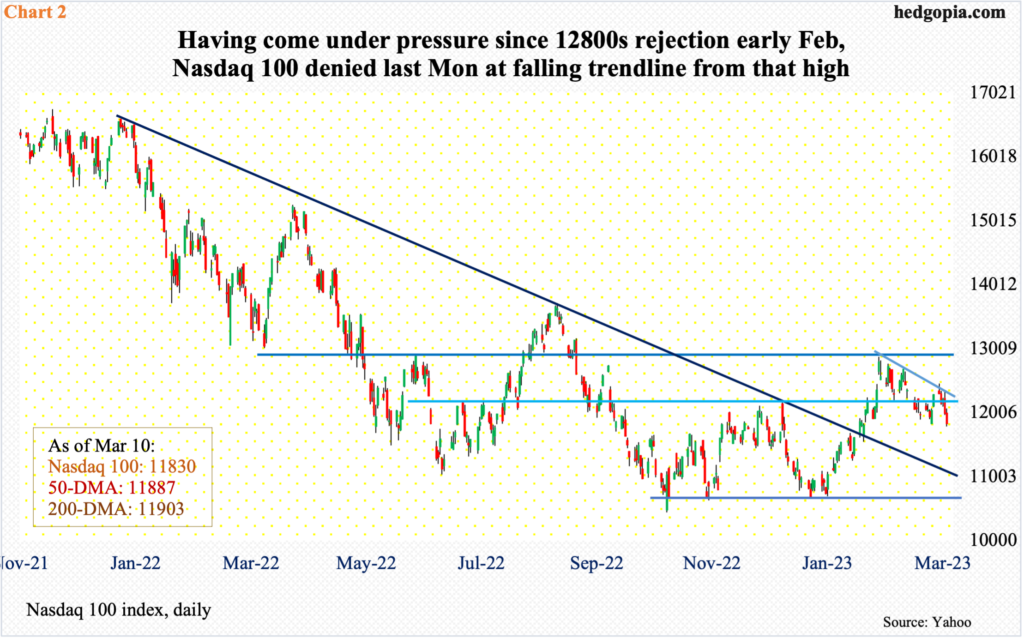
Things are similarly positioned on the Nasdaq 100. On February 2, the tech-heavy index (11830) found resistance at 12800s, ticking 12881. Same as the S&P 500, a falling trend line from that high resisted last Monday’s rally attempt, with the session ending in a spinning top (Chart 2). Immediately ahead, there is resistance at 12100s.
February’s CPI (consumer price index) is due out Tuesday. If this comes in softer than expected – or if this is viewed as favorable from the perspective of the Fed’s tightening outlook – this will act as another tailwind, in addition to the weekend developments relating to Silicon Valley Bank.
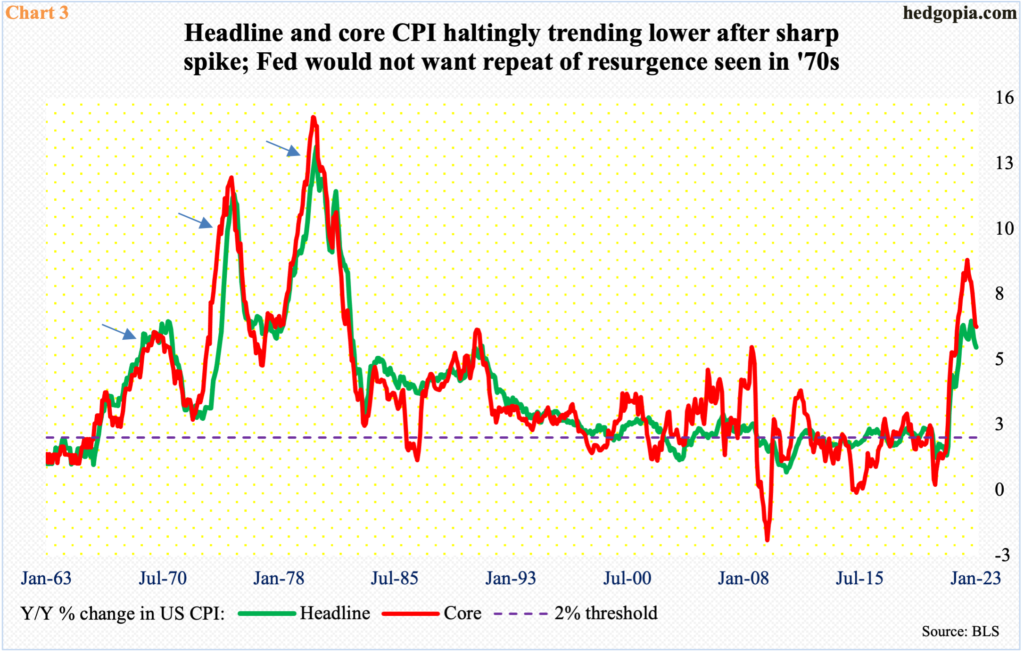
Trend-wise, on a year-over-year basis, both headline and core CPI has trended lower in recent months, with the former having peaked last year at 9.1 percent in June and 6.6 percent in September. In the 12 months to January, they respectively rose 6.4 percent and 5.6 percent, which was a little hotter than expected, but since last year’s peak, both headline and core has dropped in each month. This is going the right direction, with a lot of volatility month-over-month.
More importantly, in the past – the ’70s in particular – inflation has shown a tendency to initially fall and then resurge (arrows in Chart 3). Once bitten, twice shy! The Fed does not want a repeat of that. So, a market-friendly CPI this Tuesday can meaningfully help investor sentiment, not to mention the interest-rate outlook.
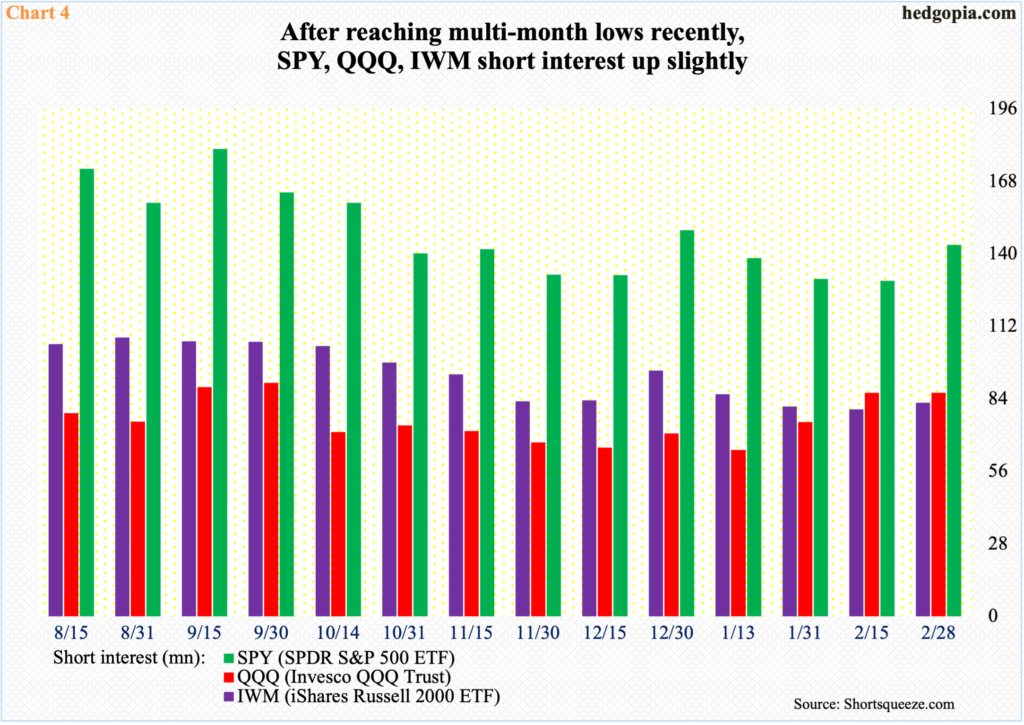
In this scenario, shorts can be tempted to leave. Not that they are aggressively short but, having meaningfully lowered their positions earlier, they added in the two-week period through the end of February.
End-February, SPY short interest rose 10.6 percent from the prior period’s three-year low. QQQ’s inched lower 0.1 percent period-over-period, but the mid-January level of 64.3 million was at a six-month low. IWM’s rose 3.1 percent p/p (Chart 4), with the mid-February count of 80 million the lowest since mid-January 2021.
In the meantime, VIX last Friday ticked 28.97 intraday before closing at 24.80. In the past, such spike reversals have tended to continue lower.
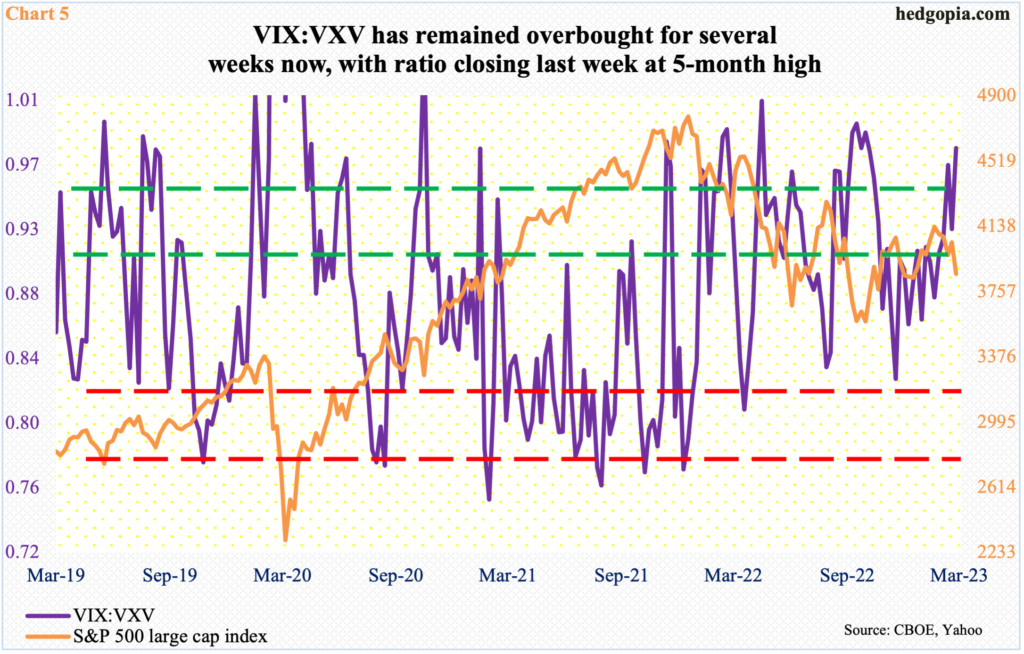
If volatility subsides and investor mood decidedly shifts to risk-on – duration and magnitude notwithstanding – demand for nearer-term protection should soften. This should lead to an unwinding of the currently overbought ratio between VIX and VXV.
VIX measures market’s expectation of 30-day volatility on the S&P 500. VXV does the same, except it goes out to three months. When the investing climate is risk-off, demand for VIX is higher than, let us say, VXV. The opposite is true when sentiment improves.
Last Friday, the ratio closed at 0.98. this was the fifth week in a row VIX:VXV ended in 0.90s – and seventh in last eight (Chart 5). This is overbought territory – meaning conditions are ripe for a reversal.
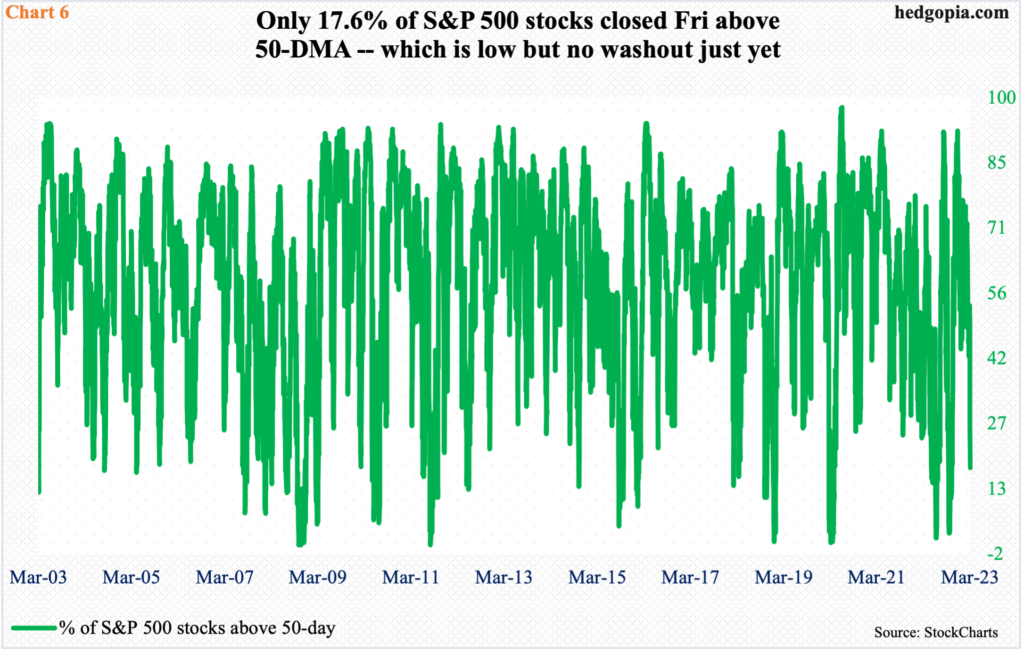
Elsewhere, merely 17.6 percent of S&P 500 stocks traded above their respective 50-day last Friday (Chart 6). This is very low, although no washout just yet. In March 2020, for instance, there were eight daily readings between one and two. Even in June last year, there were two readings of two; that said, the June low in the S&P 500 was undercut, before a low was put in October.
Last Friday’s low of 17.6 percent means a durable bottom in the metric is yet to occur. This is where it gets tricky as to how far the Silicon Valley Bank-induced relief rally might go. If bulls are unable to hang on to the overnight strength in the futures, there is a red flag right there. Then we know people are either waiting to find out what Tuesday’s CPI report brings or are worried that there might be other regional banks out there with similar problems (the cockroach theory). If Monday’s rally sticks and Tuesday’s CPI is hotter than expected, then the Fed, which presently abhors a loosening in financial conditions, which is what a rally in stocks does, will be cornered as to if it should stick to a 50-basis-point hike (very unlikely) in the March 21-22 FOMC meeting, go for a 25 (likely) or not move at all given the Silicon Valley Bank saga (unlikely).
Thanks for reading!
