- Inability of offensives to take the lead has been a thorn in the side of rally since Oct 15th low
- Outperformance last week of XLY vs. XLP and HYG vs. LQD sign of trend change?
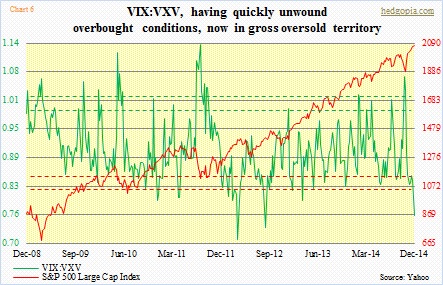
- Duel on between seasonally favorable Dec and grossly oversold VIX:VXV
Price trumps everything. In the end, it is the final arbiter. Until it is not. Hence how price is progressing today can leave us clues as to how it might progress – or not – tomorrow. One of the knocks on the equity rally since the October 15th low has been the lack of leadership by the offensive sectors. In fact, the underperformance has been going on since early this year. The brown arrow in Chart 1 shows how a combination of technology, consumer discretionary, and materials has been lagging healthcare, consumer staples, and utilities combined. This has particularly been the case since mid-August (indigo arrow). The story is the same in the large- versus small-cap arena, with the latter lagging the former since March.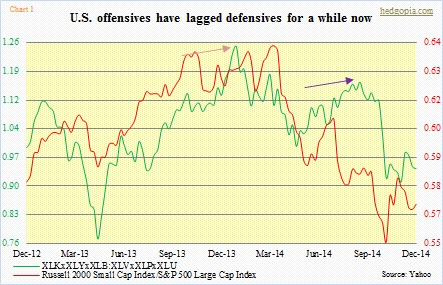
Even the bulls have trouble treating these divergences as healthy. In the past, these more often than not acted as a canary in the coalmine. So anytime things converge – in other words, divergences fade – it grabs attention. We are in the midst of one right now. This past week, XLY, for instance, led XLP, as did high-yield versus investment-grade bonds (circle in Chart 2). High-yield, in particular, has had its share of pain lately; if bids are beginning to appear, that says something. Provided this is a trend and investor mood has suddenly shifted away from defense toward offence, better days probably lie ahead for equities. Late April, when the ratio between XLY and XLP stopped going down and curled up, it coincided with a multi-month rally in stocks (blue arrow in Chart 2).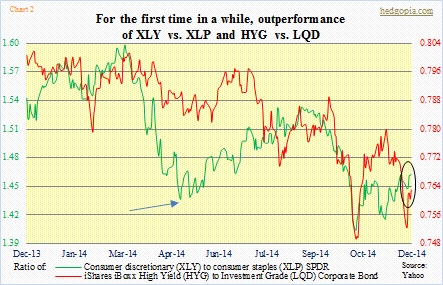
But before we pop the champagne, we need to also point out a few things. First of all, if it is a trend change, then begs the question, why the change? Because it is December? Everyone and his dog expects stocks to go up in December. Equity inflows the past several weeks have spiked as investors try to cash in on (1) the September-October correction, and (2) the December phenomenon. The past six years, December has been an up month. In the end, it could all end up being a self-fulfilling prophecy. On top of that, the November jobs report was much better than expected. Good enough to keep the jolly mood going the next several weeks? Indeed, looking at Chart 3, there is momentum in the job market. The six-month moving average has shifted above the 12-month.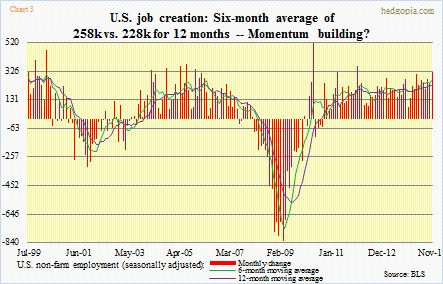
All well and good! Now on to some of the things that are not making much sense – the nitpicker that I am. First of all, in terms of XLY leading XLP last week, some perspective is in order. For the year, XLP is up 17 percent, vs nine percent for XLY. If we use price as the yardstick, clearly the former is a winner hands-down. Small-caps are another example, with the Russell 2000 Small Cap Index now up slightly north of two percent for the year; the S&P 500 Large Cap Index is up 13 percent. Can small-caps catch up in the next three-and-a-half weeks? There was some chatter going around to that effect in blogosphere, and elsewhere. December does tend to be a good month for small-caps. That will be a big tell as to if offence is indeed in vogue. For the Russell 2000 to flash that signal, it needs to rally two percent and convincingly break out of the 1200 resistance. For now, it is still range-bound, though in an upswing within that range. Hence, crossed fingers. A weekly chart continues to suggest ongoing distribution, by the way.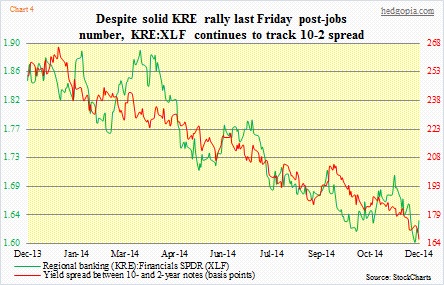
Staying with the jobs theme, KRE, the regional banking ETF, shot up 2.3 percent last week, versus 1.7 percent for its larger brethren, XLF. Eighty-seven percent of KRE’s weekly move came on Friday, the jobs day. The obvious thesis is that, with much-better-than-expected payroll numbers, the Fed would raise rates sooner than later next year. These banks live and die by interest rate spreads. The wider the spread, the greater the profits. Until we realize that the yield curve actually tightened on Friday. Yes, bonds did sell off – 10-year yield rose from 2.25 percent to 2.31 percent. But two-year yields had a sharper move – from 0.55 percent to 0.65 percent. The long end of the curve continues not to buy escape-velocity hopes and prayers. Amidst all this, large-cap financials broke out to a nearly seven year high. KRE is below its March high, and trapped in a one-year-long congestion. Despite the Friday action, the ratio of KRE to XLF continues to track the 10-2 spread. Regional banks are not on the same page vis a vis XLF breakout.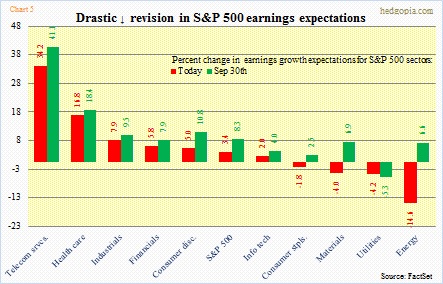
There is this, though. Earnings-growth expectations for 4Q have come down for financials. For that matter, this is true with nine of the 10 S&P 500 sectors (Chart 5). As per FactSet, utilities is the only sector with a positive revision today versus September 30th. Look at energy, which has had a 21-percent swing to the downside! With that sector accounting for one-third of S&P 500 capital expenditure, it is only a matter of time before that begins to get reflected in the overall economy. But that is not until several months/quarters later. Right here and now, December, and the seasonality that comes with it, is what matters. At least that is how most investors/traders are viewing it. Come January, the earnings bar is lower. Earnings are now expected to grow 3.4 percent for S&P 500 companies. Two months ago, this was 8.3 percent. In a rather perverse way, this may very well be adding to the aforementioned self-fulfilling prophecy. It is reflected in the VIX, and other option-related indicators. The ratio of VIX to VXV is now at a level that has consistently paid off to be cautious on equities. We will see. It is on between this indicator and the December phenomenon.