
Stocks are ripping higher. Sentiment is exuberant. Several technical indicators are extended. The Fed’s aggressive action was a catalyst in March when major US equity indices bottomed. Its asset holdings continue to grow, but the pace of growth has decelerated. Post-May’s better-than-expected job creation, its language – either in this week’s FOMC meeting or later – is worth a close watch.
How things have changed in two and a half months!
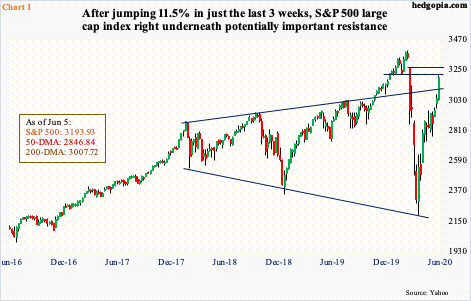
When stocks were collapsing in February and March and when it increasingly felt like selling would never stop, equity bulls put their foot down at/near important support. On the S&P 500 large cap index, the lower bound of a two-year broadening wedge was defended (Chart 1). On the Nasdaq 100 index and the Russell 2000 small cap index, support corresponding to a rising trend line and a straight line going back four years was defended (not shown here).
Ten weeks later, last Friday, the Nasdaq 100 edged past the old high from February 19th, the S&P 500 rallied within 6.2 percent from its high from the same date and the Russell 2000 is up 56 percent from the March 23rd bottom.
In ideal circumstances, small-cap bulls would love to go test 1600-plus on the Russell 2000 (1507.15); this has been an important price point since January 2018. On the S&P 500 (3193.93), it closed Friday right at six-month horizontal resistance (Chart 1). There is gap-down resistance at 3250s; the gap gets filled at 3320s. On the Nasdaq 100, the sky is the limit – rhetorically.
Here is the thing. Yes, the Nasdaq 100 managed to post a new high last Friday, but this comes against the backdrop of tech having taken a back seat the past few weeks. At the session high of 9845.69 last Friday, the Nasdaq composite squeaked by its prior high of 9838.37 from February 19th by less than eight points.
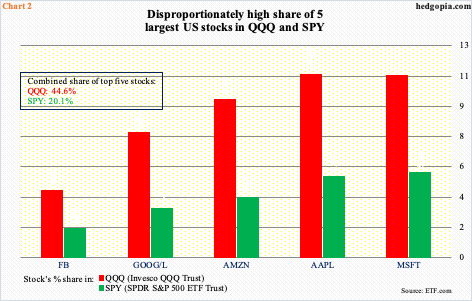
Top-five momentum is slowing down. The five largest stocks in the US are all tech. Combined, Apple (AAPL), Microsoft (MSFT), Amazon (AMZN), Alphabet (GOOG/L) and Facebook (FB) command an inordinate share of the US stock market. In SPY (SPDR S&P 500 ETF), this is 20.1 percent, and in QQQ (Invesco QQQ Trust) 44.6 percent (Chart 2).
Even though the Nasdaq 100 is at a new high, of the five, Only AAPL is. AMZN is 1.7 percent away, MSFT 1.9 percent, FB 4.4 percent and GOOG 6.5 percent. If they do not get going, because of their sheer weight, which was on an unsustainable path to begin with, major indices will feel the impact.
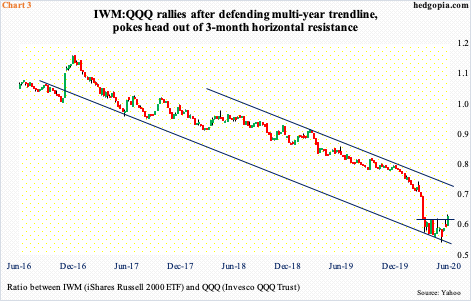
Because QQQ/Nasdaq 100 are lagging even as small-caps have begun to attract bids, a ratio between IWM (iShares Russell 2000 ETF) and QQQ is beginning to act better. From a big picture perspective, this is positive – or will be treated as such by the bulls. Small-caps inherently are more domestic-focused. Their outperformance suggests the economy is on the path to recovery.
The ratio recently bottomed, finding support on a nearly-four-year trend line (Chart 3). Friday, it closed at 0.63, nudging past three-month straight-line resistance. That said, the ratio remains in a downtrend. Around 0.7 lies the upper bound of the channel it is in. Assuming the ratio manages to test this, IWM/Russell 2000 has a lot of upside left. That is an optimistic way of looking at where things are. In this scenario, The Russell 2000 can march toward 1600, or the S&P 500 toward its own nearest resistance (Chart 1). An overbought market can stay overbought longer than bears can last. But with each push higher, what is already frothy only gets frothier.
There is no shortage of indicators that are screaming ‘froth’ right now.
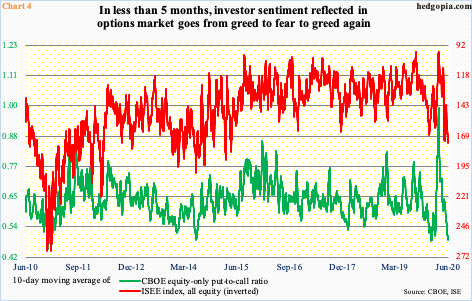
Take a look at Chart 4, which plots the 10-day moving average of the CBOE equity-only put-to-call ratio and the ISEE index. The latter is a call-to-put ratio, hence inverted. It excludes trades from market makers and brokers/dealers, and only uses opening long trades. Market makers need to hedge exposure all the time. Retail traders on the other hand bet on direction. Many consider ISEE cleaner of the two.
Last Friday, the 10-day average of the ISEE index ended at 174.70, which was the highest since April 2015 and higher than the 161.90 on February 19th this year. Similarly, the 10-day average of the CBOE P2C ratio closed Friday at 0.486, versus 0.501 on February 19th. That was the day major US equity indices peaked before collapsing.
Last week, Investors Intelligence bulls rose three percentage points week-over-week to 53.5 percent. This was the highest reading since 59.4 percent in the week to January 21st. Bulls were 54.7 percent in the week to February 18th, just before the rug was pulled out from under stocks. But bears were much lower back then – 23.7 percent now, versus 17.8 percent as of January 21st and 18.9 percent as of February 18th. Ideally for bulls, there is room for bears to jump on the bullish bandwagon.
From this standpoint, the door is wide open for AAII (American Association of Individual Investors) bears to make a switch. Last week, their count was 38.9 percent. This has gone down from 52.7 percent in the week to May 7th but remains high. In the week to February 13th, this dropped as low as 26.4 percent. AAII bulls, on the other hand, were 34.6 percent last week; ideally, this can rise to 40s, even 50s.
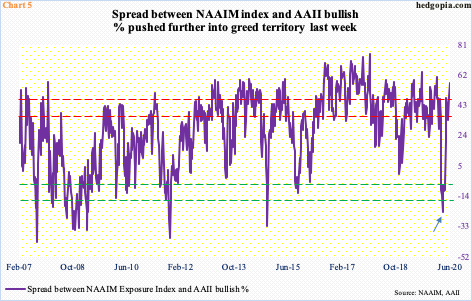
NAAIM (National Association of Active Investment Managers) bulls, on the other hand, are all gung-ho. Last week, the NAAIM Exposure Index, which represents members’ average exposure to US equity markets, expanded 10 points w/w to 91.6 – a 19-week high. These are professionals. The AAII survey is focused on retail. It turns out a spread between the two can help us identify extremes. In the week to March 18th, the spread was minus 23.7 (arrow in Chart 5); a few days later, stocks bottomed. Last week, the spread was 57. The pendulum has now swung the other way.
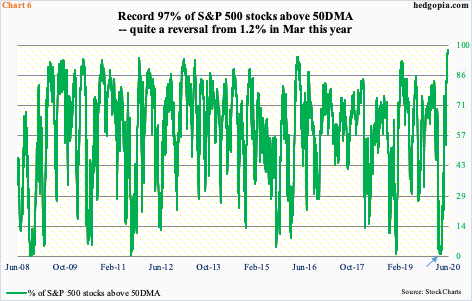
Chart 6 paints a similar picture.
In March, only one percent of S&P 500 stocks were above their 50-day moving average (arrow). It was a total washout, which laid the foundation for the rally that followed. Last Friday, this metric stood at 97 percent – a new record (data goes back to December 2001). Extreme pessimism of two and a half months ago has given way to extreme optimism.
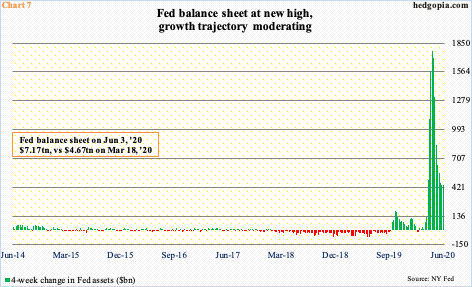
One major catalyst to help stem the indiscriminate selling in March came from the Fed. On March 23rd, it announced unlimited QE (quantitative easing). That was the day major indices put in a low. This was followed by an announcement early April to purchase investment-grade corporate bonds, which was later expanded to also include junk bonds.
Its balance sheet, having already bottomed last August at $3.76 trillion, began going parabolic. In the three months to last Wednesday, it is up $2.92 trillion, to $7.17 trillion, but the pace of growth is in deceleration. The four-week change last week was $443.8 billion, down from $1.77 trillion two months ago (Chart 7). This is a data point worth notice. At some point, liquidity-drunk investors may begin to pay attention to this.
Tuesday, the FOMC begins a two-day meeting. Until Friday, this was on its way to becoming one of those uneventful meetings. The Fed has already done a lot. Markets have stabilized. Sentiment is improving. Last Friday, a nice surprise came on the jobs front.
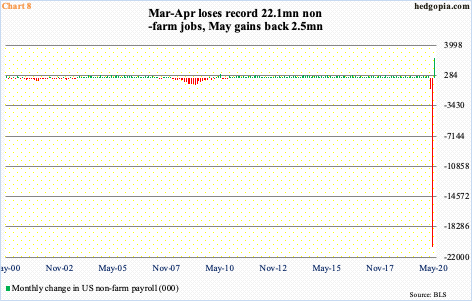
Economists were expecting a loss of 7.5 million non-farm jobs in May. The economy instead created 2.5 million. This of course came in the wake of losing 22.1 million in March and April (Chart 8). But markets welcomed the direction. Stocks jumped and bonds sold off.
It is too soon to say if May’s momentum continues. More important perhaps is how the Fed views May’s surprise. In Wednesday’s press conference, Chair Powell’s comments will be closely watched. One month does not make a trend. However, as far as markets are concerned, any hint – either in this meeting or later – that the Fed does not need to be as aggressive will in all probability not be taken kindly by investors. Particularly considering how frothy investor sentiment has gotten.
Thanks for reading!
