The following are futures positions of non-commercials as of March 10. Change is week-over-week.
10-year note: 10-year yields shed another 13 basis points in the week. Nonetheless, note owners continued to sell near 2.04 percent. And these traders, in agreement, continue to bet yields are headed higher. The 10-year remains trapped in a downtrend channel, which likely ends up deciding the next major move. The Fed is under immense pressure. On the one hand, it increasingly feels like it would like to at least begin a tightening process. On the other, (1) macro data points are far from cooperating, and (2) the dollar is already in the midst of a rip-roaring rally. Currently net short 138.3k, down 1.2k w/w.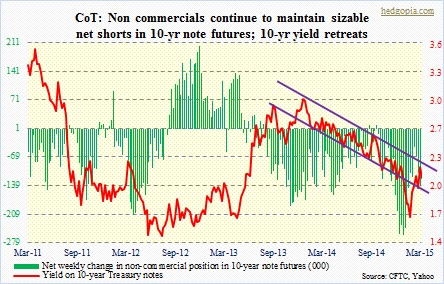
30-year bond: The 2.9-percent resistance held. Last Friday, it tested that level, closing slightly lower. This week, right from the word go, yields came under pressure. If we are to believe these traders, then yields are headed lower. They went net long, though only slightly. One can make that argument looking at a daily chart. The MACD just had a crossover (by the way, there is a similar crossover on the 10-year as well). Depending on what hear out of the FOMC next week, odds are good that yields (30-year) go test that support, at a little over 2.5 percent, which is where the 50DMA lies. Currently net long 6.6k, up 8.2k.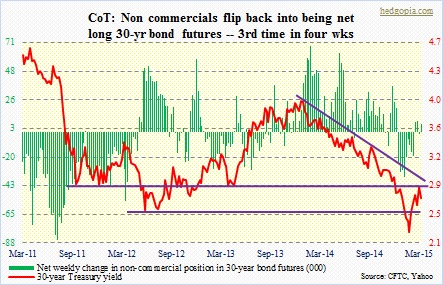
Crude oil: The WTI (spot) shed 10 percent for the week, and is essentially sitting on support. The crude has essentially gone sideways for two months now. This could potentially have been great consolidation action to use as a launching pad for a move higher. But that $53-$54 resistance came in the way. This Monday was an up day, with incessant selling pressure in the remaining four. Almost all moving averages are now pointing down. Daily indicators are oversold, but there is room for weeklies to come under pressure.
By the way, everybody and his dog seem worried not to want to miss the next big rally in oil. This kind of reminds me of how back in 2000 and 2007 people for a long time were not ready to accept that tech and financials, respectively, were in a lot of trouble. It may be an unfair comparison, but this much is true. No one is puking yet when it comes to oil. Non-commercials beg to disagree. They slightly raised net longs. Currently net long 285.7, up 8.5k.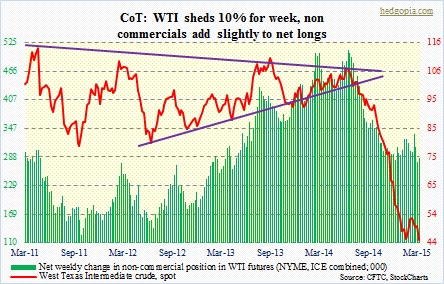
E-mini S&P 500: Whoa! Net shorts surged to a 20-week high. These traders just went net short last week after staying net long for 13 consecutive weeks. So it is hard to read into this week’s numbers. Please keep in mind that these positions are as of Tuesday, the day when the index tumbled 1.7 percent, slicing through its 50-day moving average. However, the index closed the week higher than that Tuesday close. So it is possible these positions look entirely different, particularly after Thursday’s 1.3-percent rally, which was so strong the index barely even paused at its 50DMA.
Even though the index ended the week down 1.3 percent, it was such a roller-coaster ride. It is now caught between 2064 (resistance) and 2040 (support). Thursday’s rally stopped at that resistance, even as buyers stepped in on Friday to defend support. In a textbook fashion, really!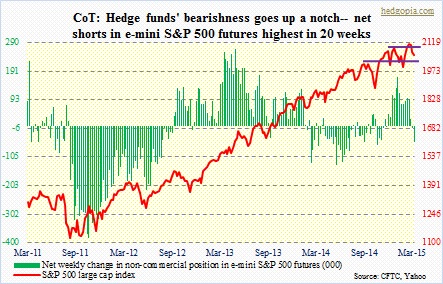
From February 25th high to March 11th low, the index fell 3.8 percent. Going back nearly a year, there have been several mid-single-digit drops that have proven to be opportunities to go long (exception being the nearly 10-percent drop in September/October last year). So is this another one of those opportunities? On a weekly chart, several indicators such as stochastics, CCI and RSI are at levels that going back to June 2013 managed to stop downward momentum and then turn up. Our own Hedgopia Risk Reward Index just entered the reward zone (more on this at the end). Or is this the beginning of at least what was experienced in September/October last year?
Cogent arguments can be made both ways. Except for February’s jobs report, essentially every other macro data points have been weaker than expected – retail sales and factory orders, for example. The Atlanta Fed’s GDPNow is now forecasting a mere 0.6-percent real GDP growth in the current quarter (as of March 12)! This, however, also ensures that the Fed maintains its dovish posture. No rate hikes any time soon. Stocks rallied hard on Thursday after a very poor February retail sales report.
On the earnings front, 1Q is expected to decline 4.9 percent year-over-year. INTC just guided the quarter lower. (Just out of curiosity, I went back and checked my old notes as a tech analyst. The company also guided down in September of 2000, blaming weak demand from Europe. Now it is blaming macro trends and a delayed upgrade cycle.) While it is clear earnings are downshifting, the 1Q reporting season is three weeks away. And the bar is now lower to meet/beat estimates.
The collapse in crude oil means cutbacks in jobs and capital expenditures, and what not. But this also means consumers get a break at the pump. At least that is the perception, though it is not showing up in spending numbers yet.
So the point is, as things stand now, depending on whether you are a bull or a bear, you can come up with a thesis supporting your bias. Perhaps the reason why, the S&P 500 is caught between 2064 and 2040. The latter also approximates October 2014 trendline support. A break out of these levels has the potential to decide the next major move. We will see. Currently net short 52.9k, up 48.7k.
Euro: Cannot catch a break. From 140 in May 2014 to 105 this week, the sell-off has been relentless. Unforgiving! Non-commercials would not be using those adjectives. Flawless is how they would describe how they played it. They started going net short right around that peak, and have ridden all the way down. Impeccable! For the week, the currency lost another six-plus percent. The ECB kicked off its program to gobble up bonds, and that was it. As if it was not known to the market already, that served as another excuse to sell euros. The sell-side is now beginning to talk about, forget parity, but 0.80. Who knows where it is headed? Should it stabilize, we will begin to see it in the chart. So far, there is none. Currently net short 181.1k, up 8.7k.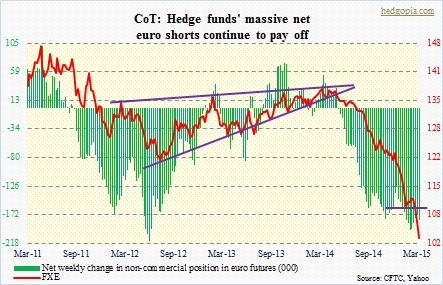
Gold: The metal is below support at 1,180. For the umpteenth of time since June 2013, gold bugs have used this support to step in and buy. Not this time. While this suggests a trend change, there may still be some hope. On a daily chart, things are so oversold a bounce may be in order. Action the past few sessions is encouraging. However, even if the metal attracts bids, it will have to get over that 1,180 resistance first. Further, both weekly and monthly indicators have room to go lower. Is this why non-commercials reduced net longs by 29 percent to a 15-week low? Currently net long 81.9k, down 33.9k.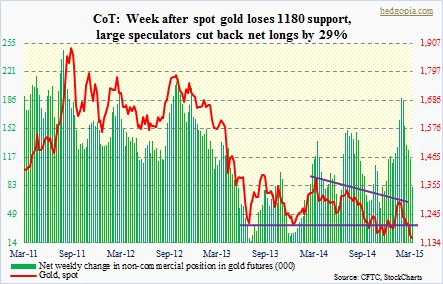
Nasdaq 100 index (mini): These traders are proving to be stubborn! Or, prescient, maybe? We will find out. After a week that saw the index drop 0.9 percent, they raised net longs by nearly 13 percent. Of course, this week did not help. The index shed 1.9 percent. At the same time, buyers so far have showed up where they were supposed to. The 104.50 level – a must-hold – on the QQQ has been defended. So far. This area, by the way, also coincides with 50DMA. So as long as buyers show up at that level, it is not a trend change. Intermediate- to long-term, AAPL has not been acting well, and that is not going to bode well for the index. Currently net long 69.4k, up 7.9k.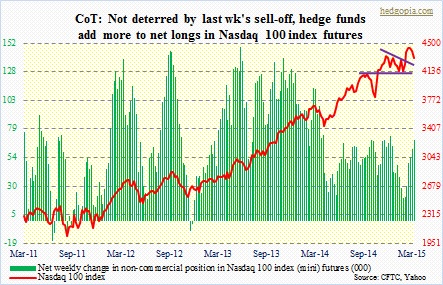
Russell 2000 mini-index: Net shorts are the highest in 19 weeks. And these traders are completely going contrarian. Over the past couple of weeks, the index has essentially gone sideways, versus -2.4 percent on the S&P 500 and -2.8 percent on the Nasdaq 100. So relatively the RUT is outperforming – always a good sign. Importantly, it is above the crucial 1200-1220 level. So long as it manages to stay above that, it is all good. In the latest period (as of Feb 27), short interest on IWM went up eight percent, to 96.4 million shares. There has been a lot of short-covering on this thing. Short interest stood as high as 172.5 million at the end of July last year, and bottomed at 89.2 million mid-February. So the potential for a squeeze is much less than back in July. Currently net short 40.7k, up 10k.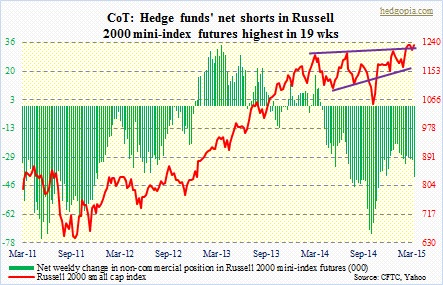
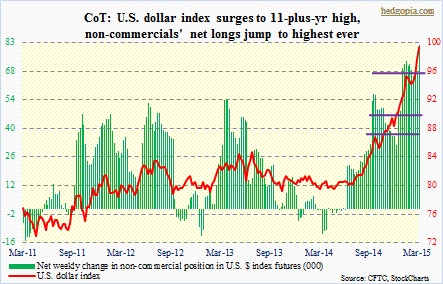
U.S. Dollar Index: The freight train marches on. Another up week. A week in which it crossed 100 but closed out just below. The euro continues to weaken, and that has played a big role in the dollar’s strength. The index gives a 57.6 percent weight to the euro. The next biggest weight goes to the Japanese yen, at 13.6 percent. Since early May last year, the euro is down 25 percent, the yen down 17 percent, while the U.S. dollar index is up 26 percent. You get the picture. The dollar is benefiting from the euro’s misery. As well, there are other factors in play benefiting the buck. Interest-rate differential being one, and unwinding of the carry trade the other.
Non-commercials seem to think this can go on for a while, raising net longs to the highest ever. While they are playing the trade perfectly, there will come a time when this unrelenting rally in the greenback will come back to bite us on the derriere – ranging from repercussions for U.S. exports to S&P 500 earnings to emerging economies. Currently net long 81.3k, up 14.1k.
VIX: They raised net shorts even more, currently at a five-month high. Near-term, the spot is acting as if it wants to go lower. On a related note, the CBOE put-to-call ratio (21DMA) is currently at .62. In the past, a reading in the high 50s have been a time to get cautious on equities. If equities rally here, the put-to-call ratio has room to go lower, toward high-50s. This is just one potential scenario. Under this, non-commercials will have gotten it right as well. Currently net short 32.4k, up 4.5k.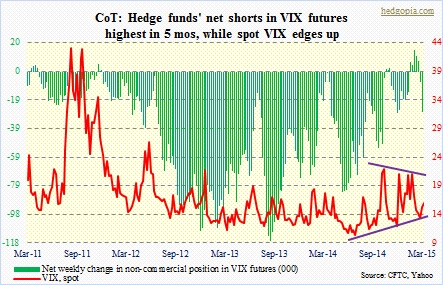
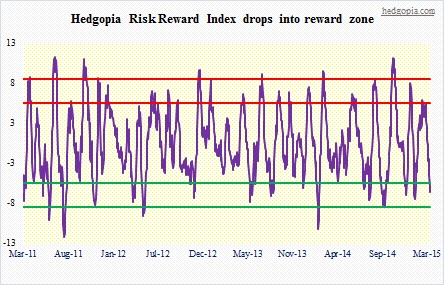
Hedgopia Risk Reward Index
It has dropped back into the reward zone. Which means there is now plenty of juice out there to push equities higher. But, as can be seen, it has just entered the zone, and has room to continue lower, and even undershoot, which is rare but has happened in the past. So, once again, a lot will depend on what happens next week, how the markets react to what comes out of the FOMC meeting.
The way equities are acting, should there be a post-FOMC sell-off, it probably gets bought.