There is a new-found spring in U.S. small-caps’ step. What changed all of a sudden? More importantly, are there ingredients in place for the rally to sustain itself?
The Russell 2000 small cap index just broke out. It has been through a lot since the U.S. presidential election last November. Post-Trump win, it rallied 16.5 percent in a month.
Money gravitated toward small-caps on the back of President Trump’s promises to cut taxes, reduce regulations and increase infrastructure spending, among others. Small-caps inherently tend to be domestically focused. After that one-month surge, the index went on a sideways journey between 1340s and 1390s, with three false breakouts.
Come August 18, the bulls defended the lower end of that range, and has since just about gone parabolic – up 10.7 percent. In the process, it has broken out to a new high – past a two-and-a-half-year rising wedge (Chart 1).
The small-cap outperformance accompanies a strong performance by financials, which have rallied strongly since bottoming on September 7 (Chart 2). At 18 percent, financials – regionals in particular – make up the largest sector within the Russell 2000. The sector rallied on the coattails of rising rates.
The Treasury yield curve widened last week. The spread between 10- and two-year notes went from 78 basis points on Monday to 86 basis points on Friday. Two-year yields rose three basis points to 1.47 percent, and 10-year 11 basis points to 2.33 percent.
In the futures market, the odds of a 25-basis-point hike in December (12-13) ended last week at 76 percent. The yield curve is adjusting to this. As well, the FOMC dot plot suggests the Fed wants to hike three more times next year – hardly pragmatic given a potential change in not only the leadership of the Fed next year but also the FOMC makeup – but traders are focused short term.
Small-cap bulls are also placing a lot of faith in the tax plan put forth by the White House last week in passing Congress. Considering the federal government already owes more than $20 trillion in debt, the plan looks very ambitious. Once again, this is not where traders’ focus is currently.
The result of all this is the afore-mentioned breakout in the Russell 2000. Non-commercials probably lent a helping hand.
As noted above, the Russell 2000 bottomed on August 18. By the 29th, it poked its head out of the 200-day moving average. By then, non-commercials had built up 87,499 net shorts in Russell 2000 mini-index futures (both ICE and CME). Soon followed short squeeze. As of last Tuesday, they had cut those back to 26,266 contracts (Chart 3). It is possible holdings have gone down more, as the Russell 2000 (cash) surged 1.9 percent Wednesday last week.
Arguably, those buying the breakout last week had the support of both fundamentals and technicals – announcement of planned tax cuts combined with technical breakout. For the latter to sustain, the former needs to come through. A lack thereof has the potential to reverberate through earnings.
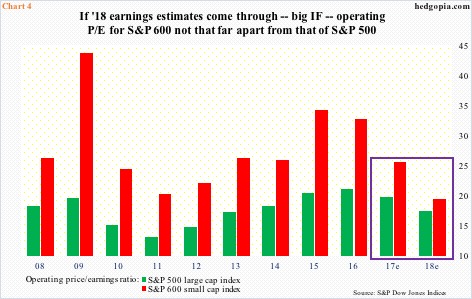
Chart 4 plots price-to-earnings ratios for both the S&P 500 large cap index and the S&P 600 small cap index. Notice the elevated red bars in 2015 and 2016. This year looks a lot better, should earnings expectations are met in the second half.
Next year is even more interesting. The P/E for the S&P 600 drops to below 20 should the expected $46.44 in operating earnings come through. This would have grown 31 percent from this year’s consensus $35.43 – looks elevated unless the planned tax cuts become law.
There is the rub. Small-caps are pricing in tax cuts, but the latter is hardly a certainty, at least in the current form.
Traders’ trust in the five-week rally – hence odds of tax cuts – will be tested by what happens around 1452 on the Russell 2000. The index is severely overbought, particularly on the daily basis. Last Friday closed with an RSI of 81.82 – the highest since June 2003! Unwinding is just a matter of time. The bulls need to pull off a successful breakout retest of 1452, or risk the recent enthusiasm begin to wear off.
Thanks for reading!

