
Following futures positions of non-commercials are as of Sep 26, 2017.
10-year note: Currently net long 256.6k, down 13.5k.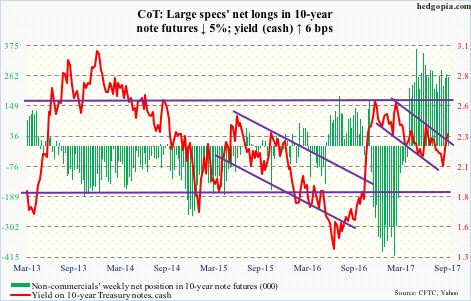
The Treasury yield curve widened this week. The spread between 10- and two-year notes went from 78 basis points on Monday to 86 basis points on Friday. Two-year yields rose three basis points to 1.47 percent, and 10-year 11 basis points to 2.33 percent.
Is this bear-steepening, in which the long end rises faster than the short end, pricing in higher growth expectations, hence higher inflation expectations, or just technical in nature?
One thing is for sure.
The Fed just about convinced the markets that it will move in December, with futures-market odds of a 25-basis-point hike of 76 percent. The yield curve may be adjusting to this. The dot plot also suggests the Fed wants to hike three more times next year!
How pragmatic is this, given a potential change in not only the leadership next year but also the FOMC makeup?
Janet Yellen’s term as chair expires in February next year.
The Federal Reserve Board is made up of seven members, while the FOMC consists of 12 voting members – the seven plus New York Fed president, who always votes, and four of the remaining 11 Reserve Bank presidents, who serve one-year terms on a rotating basis. This year, Chicago, Dallas, Minneapolis, and Philadelphia are the voting four.
Early this month, Stanley Fischer, vice chair, resigned effective in mid-October. His term would have ended in June next year. With this, four of the seven seats of the Board will remain vacant. One of the seats will be filled by Randal Quarles, if confirmed. His nomination is pending before the Senate.
So even if Ms. Yellen gets the nod from President Trump – not at all certain – he has the opportunity to reshape the leadership of the bank by nominating three more. Which means we could be looking at a completely different dot plot come next year. Markets are still obsessed with the current one.
30-year bond: Currently net long 52.9k, down 5.2k.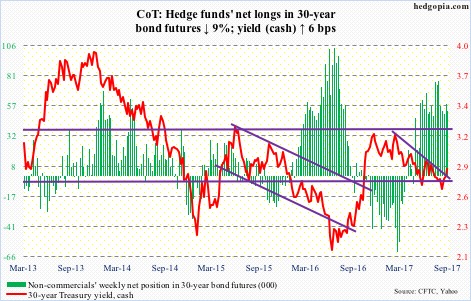
Major economic releases next week are as follows.
Monday brings the ISM manufacturing index for September, and Wednesday the ISM non-manufacturing index.
Manufacturing activity in August rose 2.5 points to 58.8 – the highest since April 2011 – even as services activity increased 1.4 points to 55.3.
August’s revised durable goods data are published Thursday. Preliminarily, orders for non-defense capital goods ex-aircraft – proxy for business capital expenditures – rose 3.6 percent year-over-year to a seasonally adjusted annual rate of $64.8 billion. Orders peaked in September 2014 at $70.3 billion.
Friday brings the employment report for September. August saw the non-farm sector add 156,000 new jobs – slower than the year-to-August average of 176,000. In 2016, the monthly average was 187,000, versus 226,000 in 2015 and 250,000 in 2014.
Crude oil: Currently net long 461.3k, up 59.6k.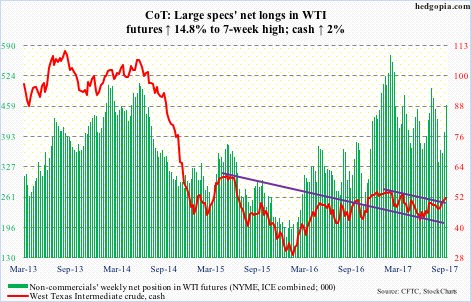
Having broken out two weeks ago of trend-line resistance from February this year, spot West Texas Intermediate crude ($51.67/barrel) rallied further this week. Near term, the best the bulls can hope for is a test of resistance at $54-plus.
But given how extended the daily chart is, that may not even take place before unwinding overbought conditions. Thursday’s rally attempt was denied at the daily upper Bollinger band. A test of the 200-day moving average ($49.64) is more likely near term.
In the week to September 22, crude stocks fell 1.8 million barrels to 471 million barrels. This was the first weekly drop in four.
Distillate stocks fell, too – by 814,000 barrels to 138 million barrels, while gasoline stocks rose 1.1 million barrels to 217.3 million barrels.
Both crude production and imports increased – the former by 37,000 barrels/day to 9.55 million b/d and the latter by 59,000 b/d to 7.43 mb/d.
Refinery utilization continued to rise – up 5.4 percentage points to 88.6 percent. Post-Harvey, it dropped to 77.7 percent two weeks ago.
E-mini S&P 500: Currently net long 119.7k, up 18.4k.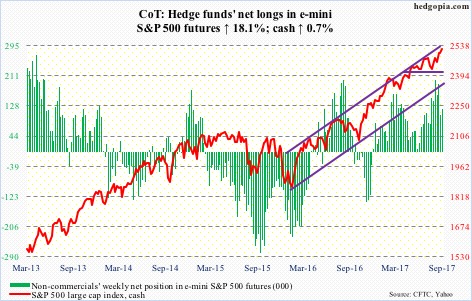
Near-term support at 2480-90 on the cash was tested Monday – successfully. The bulls were able to build on that with a new intra-day high of 2519.44 on Friday.
This was preceded by a slight increase in short interest on SPY (SPDR S&P 500 ETF) mid-September, which rose 5.3 percent period-over-period. Shorts likely got squeezed. That said, they are not getting very aggressive.
The week to Wednesday also saw outflows of $9.7 billion from U.S.-based funds (courtesy of Lipper).
In the same week, SPY itself lost $2.6 billion. As did VOO (Vanguard S&P 500 ETF) and IVV (iShares core S&P 500 ETF) – $11 million and $1.4 billion, respectively (courtesy of ETF.com).
Euro: Currently net long 88.2k, up 25.4k.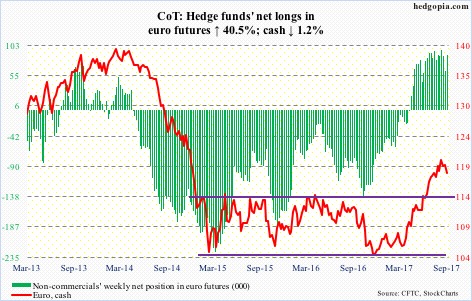
The week began with a gap-down on the cash (118.13), testing support at 118.40-ish, which was lost in the next session.
There is plenty of room for the euro to continue lower on the weekly chart, but near term a bull-bear tug of war is likely around that broken-support-turned-resistance. The 50-day moving average (118.39) lies right there.
Tuesday, Wednesday and Friday produced daily doji.
Gold: Currently net long 212.6k, down 23.5k.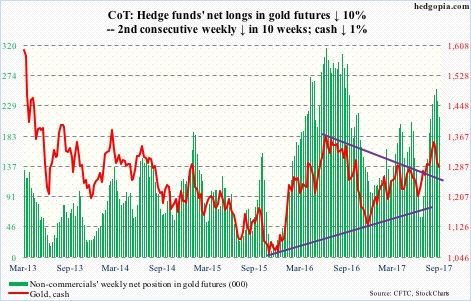
Gold bugs were unable to save crucial support at $1,300/ounce, which also approximates the 50-day ($1,297.15). Flows into gold-focused ETF’s were positive, but not enough to offset selling pressure.
In the week through Wednesday, per ETF.com, $778 million moved into GLD (SPDR gold ETF) and $191 million into IAU (iShares gold trust).
Where the metal ($1,284.8) goes from here likely gets decided by whether weekly or daily conditions prevail. The former is overbought and the latter oversold.
In a worse-case scenario, gold tests a trend line from last December near $1,240, which is about where the 200-day ($1,247.57) lies.
Non-commercials reduced net longs for the second week, but still have sizable holdings.
Nasdaq 100 index (mini): Currently net long 28.3k, down 10.3k.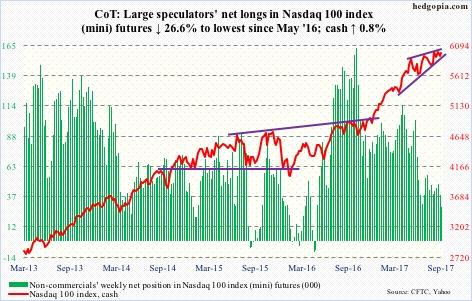
The cash (5979.3) has been trapped in a rising wedge for four months. It briefly fell out of it on Monday, but was saved in the nick of time.
Short interest on the Nasdaq composite remains elevated, and this could end up helping the bulls if they can force a squeeze.
The 6000 level has resisted rally attempts for a couple of months now, with a high of 6012.95 on September 18.
In the week to Wednesday, QQQ (PowerShares QQQ trust) lost $1.1 billion (courtesy of ETF.com).
Russell 2000 mini-index: Currently net short 26.3k, down 16.2k.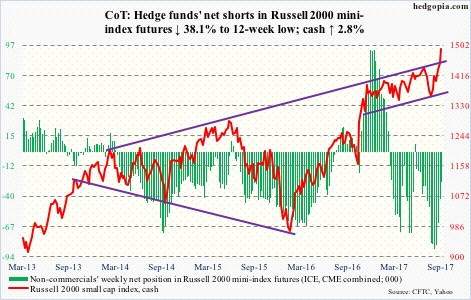
The cash (1490.86) traded within a rising wedge for nearly four years now. This was broken this week – to the upside – thanks in particular to Wednesday’s 1.9-percent surge. The index also rose to a new high, and has gone parabolic since the intraday low of August 18. It has rallied north of 10 percent since. The daily RSI ended the week at 82 – way overbought.
Non-commercials are getting squeezed.
Small-cap bulls are placing a lot of faith in the tax plan put forth by the White House this week to pass Congress. It is probably too soon to conclude that, considering the federal government already owes more than $20 trillion in debt. But the crowd thinks otherwise.
For now, the bulls are sitting pretty. Nearest support lies at 1452.
In the week to Wednesday, inflows of $39 million into IWM (iShares Russell 2000 ETF) were much weaker than prior week’s $1.9 billion, but were positive nonetheless (courtesy of ETF.com).
US Dollar Index: Currently net short 6.6k, up 390.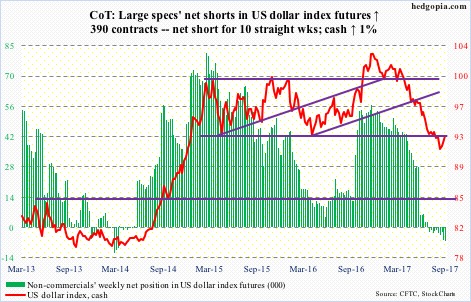
Riding the coattails of rising interest rates, the cash (92.88) finally broke out of broken-support-turned-resistance at 92.50-60. It also took out the 50-day.
On the weekly chart, the dollar index has plenty of room to continue higher, but near term the bulls may not be out of the woods, with daily conditions now overbought. A retest of the afore-mentioned level is a must-save for the bulls.
VIX: Currently net short 172.4k, up 1.2k.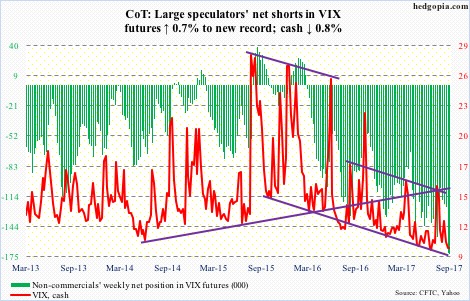
The VIX-to-VXV ratio has stayed oversold for six weeks now, with four of them in mid- to high-0.70s and two low-0.80s. At least going back two and a half years, the ratio has lingered in oversold territory for weeks before spiking.
This is not going to happen until spot VIX begins to demand premium. Since September 5 when it rose to 14.06, rally attempts for the most part have been consistently sold, including this week, with all five sessions dipping below 10 intraday and three closing under.
In the meantime, the 21-day CBOE equity put-to-call ratio dropped to .605 nine sessions ago, before rising a tad. But at .619, there is plenty of room to rise. Several times in the past, the ratio in high .50s-low .60s have been a signal to get cautious on equities – at least short-term.
Thanks for reading!
