U.S. stocks have gone 12 straight sessions without even a sliver of a bounce. About time for a reprieve?
Between the December 29th intra-day high and January 15th low, the S&P 500 and Dow Industrials each lost 10.8 percent, the S&P 400 12.6 percent, the Nasdaq 100 13.1 percent, and the Russell 2000 15.2 percent.
Particularly on a daily basis, momentum indicators are grossly oversold… weekly will soon get there.
Early last week, there were some early signs of stability, only to come under renewed pressure in the latter half of the week.
That said, the odds of at least a relief rally are growing.
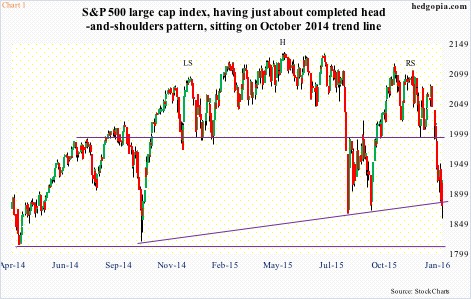
When the S&P 500 lost 1990 in the first week of the year, it also lost the neckline of a head-and-shoulders pattern. A measured-move target puts the index at 1845, not too far away from Friday’s low of 1858. The index is also sitting at a trend line drawn from the October 2014 low (Chart 1).
As of Friday, only 11.4 percent of S&P 500 stocks were above their 50-day moving average. On a broader scale, focusing on the NYSE composite, a mere 11.7 percent of stocks were above that average. This is lower than during the October 2014 bottom in stocks, but higher than during the August 2015 low. Regardless, the green line in Chart 2 remains extremely oversold.
This is taking place at a time when spot VIX is giving out signs of fatigue. On the surface, VIX is acting just fine. Anchored in a higher range, it has been trending higher since last Christmas (Chart 3). A closer look reveals subtle weakness under the surface.
Last Friday’s action could very well mark a reversal near-term, closing substantially off intra-day highs. The session had VIX spiking past the upper Bollinger Band but closing below, although it closed right on short-term support. Separately, VIX:VXV is in backwardation, which suggests the market expects volatility to come in.
Put it all together and the question of the moment is not if stocks rally here, the question is how far they are likely to go from here.
It is not uncommon to go test broken support. On the S&P 500, it is 1990, which is 5.9 percent away. Similarly, on the Dow Industrials the nearest resistance is 3.8 percent away (16600), on the S&P 400 6.3 percent away (1350), on the Nasdaq 100 5.1 percent away (4350), and last but not the least on the Russell 2000 7.2 percent away (1080).
Nothing says the indices cannot break out of their respective resistance. As a matter of fact, two of the five above – the Russell 2000 and S&P 400 – recently undercut October 2014 lows, while the remaining three are at/near August/September 2015 lows. Off both those lows, all five indices rallied vigorously, with the S&P 500, for instance, jumping 13 percent in five weeks between late September and early November last year. Stocks today are as oversold, if not more.
That said, rallies of similar magnitude are possible, but not probable.
Leading up to the current carnage in stocks, the foundation looked solid on the surface, but signs of wear and tear were showing up.
On the Nasdaq 100 in particular, action was hot and heavy among Facebook (F), Amazon (AMZN), Netflix (NFLX), and Alphabet (previously Google; GOOGL) – the so-called FANG names. The index rallied 8.4 percent last year – much better than its peers. But the problem of reliance on just a few names comes with cost.
After an incessant rally, the Nasdaq 100 produced a doji in November, followed by a red candle in December. So far this month/year, it is down 9.8 percent. The December high was a mere 1.6 percent from the March 2000 all-time peak – potentially a double-top (Chart 4).
As well, of the four, AMZN, FB and GOOGL had a monthly doji in December, while NFLX had what looks like a shooting star. These are all exhaustion signs, and could signal a sharp shift in sentiment.
Over on the S&P 500, in September last year the index crossed under its 20-month exponential moving average. This was taking place for the first time in five years. The subsequent rally had it once again climb back over the average. Come January, however, the green line in Chart 5 crosses – again – under the red line, which is now beginning to hook down. Noticeably, there was a similar bearish crossover in late 2000 and early 2008.
Further, fund flows are not cooperating. Neither is margin debt, which peaked at $507.2 billion in April last year. By November, this had dropped to $472.8 billion. With the drop in stocks in December and so far in January, the risk is margin debt continues to shrink. This will potentially result in the green line in Chart 6 staying on the current trend. The ratio of NYSE margin debt to its 12-month average has remained below parity for four months now. Once it sustains, stocks suffer (circles in the chart).
But this is a medium- to long-term worry. The ultimate risk to the S&P 500 is a breakout retest of the March 2000 and October 2007 peaks (Chart 5).
Near-term, the path of least resistance is up.
In a worse-case scenario, the S&P 500 (1880) drops to 1815-1820 (Chart 1), and the Nasdaq 100 (4141) to 3800 (Chart 4). On the latter, the March 2009 trend line extends there, as does October 2014 trend line. This is a low-odd scenario, but worth keeping on the back of one’s mind.
Thanks for reading!

