
Major U.S. equity indices are at/approaching their respective 200-day moving average, even as they have pushed into oversold territory.
At last Friday’s lows, the S&P 500 large cap index came within 0.03 percent of that average, the Russell 2000 small cap index 0.56 percent, the Dow Industrials 0.65 percent, and the Nasdaq composite 1.85 percent.
This will be the first test of that average since the Brexit low (denoted by blue arrows in Charts 1/2/3/4). Since the 200-DMA is still rising, the test is taking place at a higher price. Unlike back then, the 50-day moving average is dropping on all four.
In the process of getting here, they have all suffered technical damage.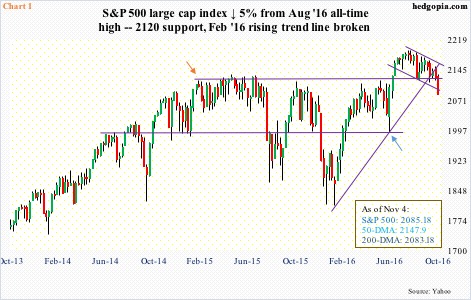
In February last year, the S&P 500 hit 2120 and then retreated (orange arrow in Chart 1). Until July this year, that price point – or thereabouts – provided stiff resistance. A July breakout subsequently pushed the index to 2193.81 on August 15 before coming under pressure. What followed was gradual deterioration.
The 50-day moving average began to roll over. The 2120 support, which held off selling pressure in September and October, gave way on November 1. Importantly, a rising trend line from February this year was lost as well, with a failed backtest already.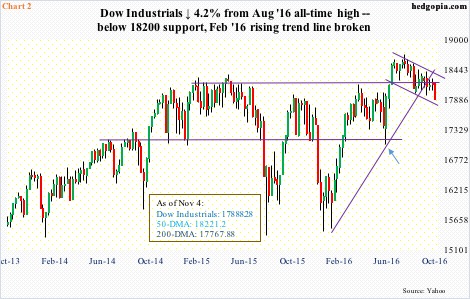
The Dow Industrials has charted out a similar pattern – began to go sideways since February last year, with 18200 providing resistance until July. It then reached an all-time high of 18668.44 on August 15, before weakening.
The 18100-18200 support is now gone. Ditto with the February 2016 rising trend line. The Dow still finds itself within a descending channel that began to form shortly after the July breakout (Chart 2), while the S&P 500 has slightly breached a similar channel (Chart 1).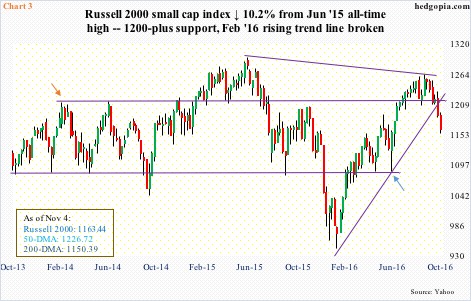
Over on the Russell 2000 small cap index, things are a lot worse. Back in March 2014, it hit 1212.82, before slightly retreating (orange arrow in Chart 3). That turned out to be an important price point. In February last year, after several attempts, the Russell 2000 was finally able to break out of it, but in August the 1200-plus level was lost again.
Since then, there have been several ups and downs, but unlike the S&P 500, Dow Industrials and the Nasdaq composite, the Russell 2000 was unable to make a new high. The June 2015 high of 1296 remains, with 1263.46 on September 22 representing a lower high.
In the current sell-off, the Russell 2000 has lost 1200-plus as well as a rising trend line from February this year, is now down slightly over 10 percent from its all-time high. If small-caps are used as a gauge of traders’ sentiment, the mood is decidedly risk-off.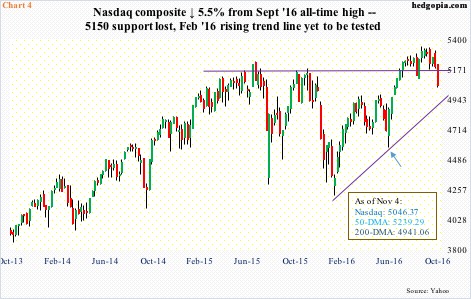
The Nasdaq composite fares better versus small-caps. It rose to an all-time high of 5342.88 on September 22, having rallied past the prior March 2000 high of 5132.52 in August, but was unable to meaningfully build on that breakout.
Support at 5150 is gone. That said, of the four indices discussed here, the Nasdaq is the only one not to have tested the February trend line, which will be tested around 4900 (Chart 4).
From its recent high, the Nasdaq composite has shed 5.5 percent, versus five percent for the S&P 500 and 4.2 percent for the Dow. Daily momentum indicators on all three – as well as on the Russell 2000 – are grossly oversold. In normal circumstances, this probably would have been enough for equity bulls to step up and defend the 200-DMA. Particularly considering how overbought the VIX-to-VXV ratio is.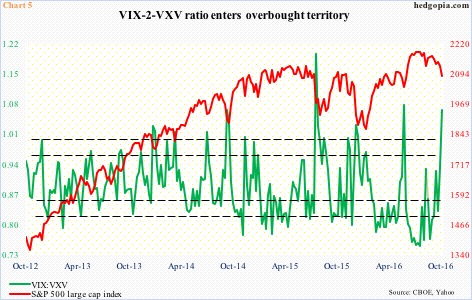
As of last Friday, the ratio stood at 1.07 – way overbought and the highest since the June 20th week this year. That was the post-Brexit high, when the ratio jumped to 1.08 (Chart 5). Spot VIX surged to 26.72 on June 27 before giving out signs of a reversal.
Last Friday, VIX rose to 23.01, before closing on 22.51. It has now risen for nine consecutive sessions – a record. Nonetheless, the spot is yet to flash a spike reversal. One can potentially show up this week.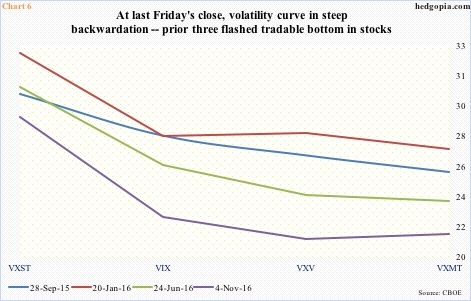
In the meantime, the VXST (nine days)-VIX (30 days)-VXV (three months)-VXMT (six months) curve has entered backwardation (Chart 6). Demand for near-term protection is elevated. Such fear sooner or later tends to get unwound. In September last year, and January and June this year, the curve similarly was in backwardation, marking decent bottom in stocks.
It is possible to come up with a whole host of scenarios as to which way the wind may blow near term after the U.S. election tomorrow.
A Clinton win with control of Congress probably results in a rather quick unwinding of the oversold conditions the indices are in – and then some. If Trump prevails and Congress remains in the hands of Republicans, markets’ initial, knee-jerk reaction is likely to be adverse. That said, in particularly the past couple of weeks, equities have been discounting the possibility of a Trump win. The initial adverse reaction may very well be bought, which is what happened post-Brexit.
Near term, either way, a relief rally likely is in the cards. The only question is, does one begin right around here or from a lower level?
Medium-term, a Clinton win probably also ensures a rate hike in December, a possibility of which the markets will then start obsessing over. In this respect, it is worth pointing out that monthly momentum indicators on all four indices above have turned lower. Hence, more important – in the case of a rally – is what happens around the afore-mentioned support-turned-resistance, and the now-declining 50-day moving averages.
Thanks for reading!
