U.S stocks are off to a stumbling start in 2016.
In the year’s first eight sessions through intra-day lows yesterday, the Dow Industrials lost 7.3 percent, the S&P 500 large cap index 7.5 percent, the Nasdaq composite 9.6 percent, and the Russell 200 small-cap index 11 percent!
Using yesterday’s lows, major U.S. indices are not that far away from late-September 2015 lows, with the S&P 500 a mere 0.8 percent away, the Nasdaq composite 0.7 percent, and the Dow Industrials 1.1 percent. The Russell 2000 small-cap index has gone on to undercut the September low by 6.8 percent.
The late-September lows are a good reference point in that the indices all rallied vigorously since that bottom. From September lows through early December, the Nasdaq composite and the Russell 2000 jumped 15 percent and 12 percent respectively. And through early November, the S&P 500 and the Dow Industrials each rallied 13 percent.
Back then, indices were deeply oversold. That is also the case now. Back then, spot VIX shot up to just north of 28, before reversing. That is also the case now. The so-called fear index jumped to just north of 27 on Monday, before coming under pressure, although it rallied 12-plus percent yesterday.
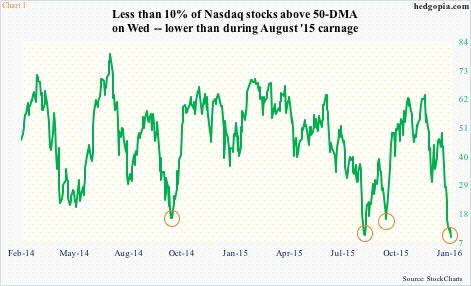
Also back then, the percent of Nasdaq stocks above the 50-day moving average bottomed on the 29th (September) at just under 16 percent. This time around, it sunk to below 10 percent yesterday (Chart 1). Historically, whenever readings are this low, a rally follows.
But what are the odds stocks rally with the same vigor as back in September?
Flows remain a suspect. In the week ended Wednesday last week, $12 billion flew out of U.S.-based equity funds (courtesy of Lipper). This more than offset the prior week’s $10-billion inflows. In five weeks, north of $32 billion have been withdrawn, and since September 30th $20.6 billion.
In the meantime, earnings expectations have further taken a hit. On September 30th, operating earnings estimates of S&P 500 companies were $111 and $129.40 for 2015 and 2016 respectively. As of December 31st, this had dropped to $106.38 and $125.56 in that order. At current estimates, earnings would have dropped 5.9 percent in 2015 over 2014, but are expected to jump 18 percent this year over 2015! With this late in the cycle, the number of investors/traders taking this optimism with a grain of salt has probably gone up.
A bigger stumbling block to the potential of a powerful rally probably comes from short interest.
End-December data was published Tuesday, and there is distinct contrast between how it stands now versus how it was in late September
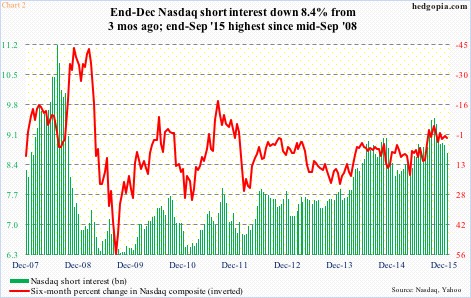
On the Nasdaq, end-September short interest stood at 9.5 billion, which dropped to 8.9 billion by mid-November and further to 8.8 billion by mid-December (Chart 2). The latest count is 8.7 billion – nowhere near as high as three months ago to potentially cause a squeeze.
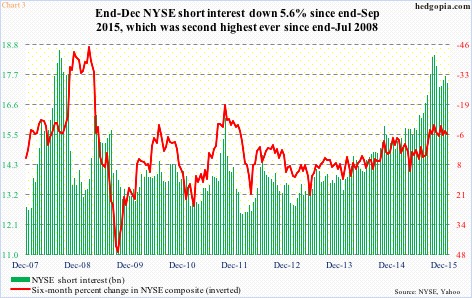
Over on the NYSE composite, it is the same phenomenon at work, with the latest count of 17.4 billion much lower than the end-September tally of 18.4 billion (Chart 3).
That said, short interest remains high on both these indices. But the fact remains that it is weaker than three months ago when a major rally (in stocks) began.
Breaking this down further along sectors and industries, the picture becomes even clearer.
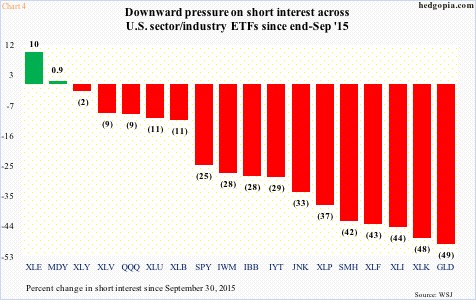
Chart 4 highlights the percent change in short interest in several ETFs from three months ago. It is a sea of red. Of the 10 S&P sectors, energy is the only one that is higher versus September 30th. The other is the S&P 400 mid-cap index, which is essentially unchanged. The rest are all down, it is just a matter of by how much.
This definitely weakens the odds of a squeeze similar to the one that followed the late-September bottom in stocks, let alone a major one.
Thanks for reading!

