
The Russell 2000 small cap index is dangerously close to breaking down. On Wednesday, it violated a rising trend line from February last year – albeit only slightly.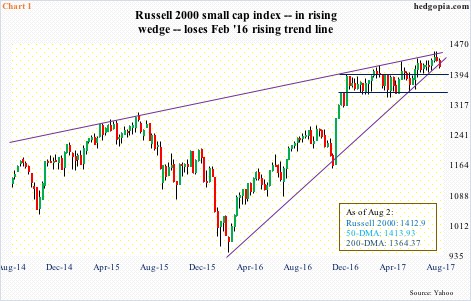
Of the four major indices, the Russell 2000 is the first to lose that trend line (Chart 1). That low was a major bottom for all these indices. Through the all-time high of 1452.09 last week, the Russell 2000, for instance, rallied 54 percent.
On the S&P 500 large cap index (2477.57), the Feb 2016 trend line does not get tested until 2440. On the Nasdaq 100 (5914.23), this lies at 5450 and on the Dow Jones Industrial (22016.24) at 21600.
The Russell 2000 had been trapped in a multi-year rising wedge. Throughout this year, it rallied along the upper bound of that wedge, but was not able to break out. In general, the pattern tends to be bearish.
On Wednesday, the index closed near its 50-day moving average, and will get interesting if it pushes below 1390s.
For several months, the Russell 2000 played ping pong between 1390s and 1340s, before breaking out two months ago. The bears would have won a major victory if they can push it under that support (blue rectangle in Chart 1).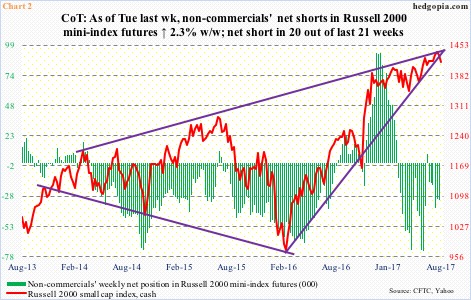
Small-caps’ performance this week – and in preceding weeks for that matter – corresponds with persistent bearish bias by non-commercials.
As of Tuesday last week, these traders have doggedly remained net short Russell 2000 mini-index futures in 20 out of 21 weeks.
They first switched from net long to net short in the week through March 7. The cash closed on 1374.88 in that session, so apparently has rallied nicely. Despite this, non-commercials have stayed put with their bear thesis (Chart 2).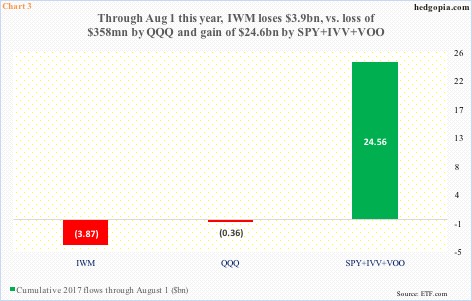
This is also reflected in flows into – or a lack thereof – IWM (iShares Russell 2000 ETF).
Through August 1 this year, $3.9 billion came out of the ETF (courtesy of ETF.com).
This compares with outflows of $358 million QQQ (PowerShares Nasdaq 100 ETF) suffered during the same period. In contrast, SPY (SPDR S&P 500 ETF), IVV (iShares core S&P 500 ETF) and VOO (Vanguard S&P 500 ETF) combined attracted $24.6 billion (Chart 3).
The inability to attract funds has hurt the Russell 2000, which year-to-date is up 4.1 percent, versus 10.7 percent for the S&P 500, 11.4 percent for the Dow Industrial, and 21.6 percent for the Nasdaq 100.
Over time, this under-performance can erode longs’ patience – potentially. Risk rises if Wednesday’s loss of support sticks.
Thanks for reading! Please share.
