
The ratio of Russell 2000 to S&P 500 fails at the upper line of an ascending triangle. Concurrently, the small cap index fails to save 1600-plus breakout retest.
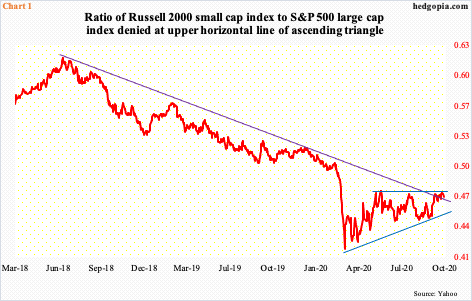
The ratio of the Russel 2000 to the S&P 500 is retreating from a potentially crucial level. Last Friday, it closed at 0.473, which was also hit early this month as well as early August and early June before that (Chart 1). The resistance is holding firm and is part of an ascending triangle.
In general, an ascending triangle is considered to be a continuation pattern. If this holds true in this instance, then Russell 2000:S&P 500 has been in a downtrend since June 2018. The ratio tried to break out of the falling trend line this month, but the horizontal upper line of the triangle came in the way.
In the sessions ahead, odds have grown that the ratio at least heads toward the rising lower trend line, which small-cap bulls hope, holds. Else, risks grow the triangle is indeed part of a continuation pattern.
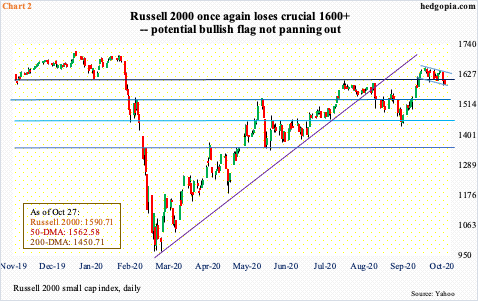
Even as the ratio turned back from resistance this week, the Russell 2000 failed at a potentially bullish pattern. Before the week began, the small-cap index was going back and forth between two parallel lines of what could have been a bullish flag. But a breakout was necessary, which failed to materialize.
Tuesday, the index closed right at the lower line. Odds are stacking up against the bulls now. They already lost – once again – crucial 1600-plus. This has been an important price point going back to January 2018. Bulls lost the level in February, right before a waterfall dive.
After the Russell 2000 found support at 960s in March, the rally that followed stopped just north of 1600 in early August. In the latter sessions of September, bulls regrouped around 1450s and charged at that ceiling again, which gave way three trading weeks ago. After this, the index went on to rally to 1652.05. Bulls were still hopeful that a combination of lower highs and lower lows since that high was part of a bullish flag. But this week they ended up losing 1600-plus, with a failed breakout retest.
In the sessions ahead, odds have grown that the index (1590.71) proceeds to test the 50-day (1562.58). After that lies horizontal support at 1530s and 1450s if things quickly unravel (Chart 2).
Thanks for reading!
