The Russell 2000’s 250-point surge over six sessions took many by surprise, not the least of which are those who were on the shorting side. This also comes at a time of probable economic deceleration ahead and a question mark over the likelihood in the quarters ahead of aggressive rate cuts by the Fed.
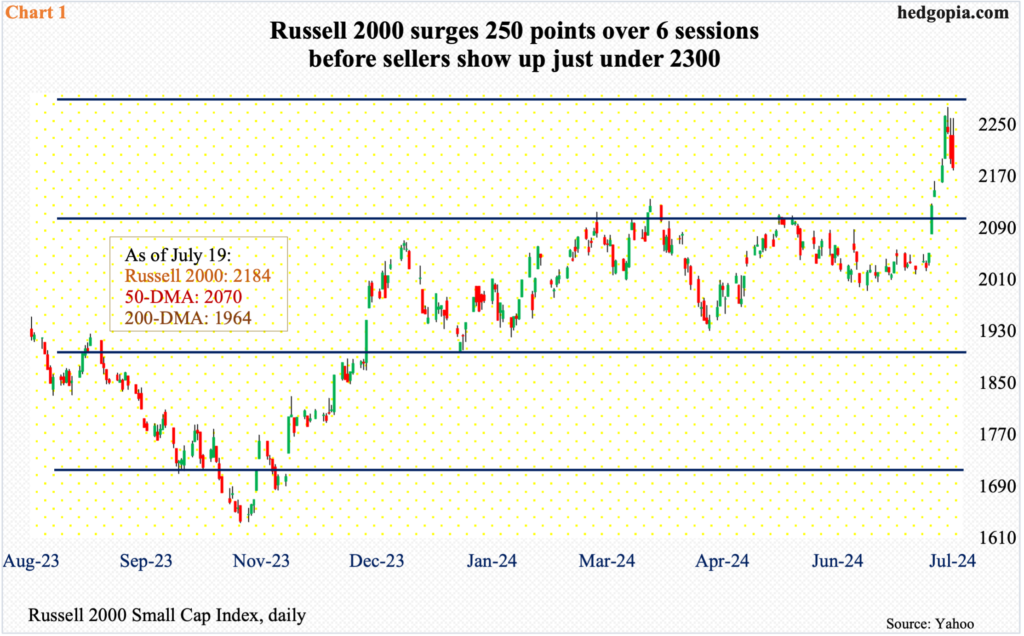
The Russell 2000 rose 1.7 percent to 2184 last week – not too shabby but was shabby considering the small cap index was up as much as six percent at Wednesday’s intraday high of 2278. If small-cap bulls were able to hold the gains, this would have come after a six-percent gain in the week before, but that was not to be. Wednesday’s shooting star reversal followed Tuesday’s bullish marubozu; the week ended in a shooting star as well.
Things reversed after the Russell 2000 surged 250 points in merely six sessions, and it occurred at a potentially important technical spot. The reversal took place just short of 2300.
Earlier, on the 11th (seven sessions ago), the Russell 2000 broke out of 2100, which has proven to be an important level. Bulls struggled there going back to March; 2100 also represents a measured-move price target after the index, which was stuck between 1700 and 1900 beginning January 2022, broke out last December (Chart 1). Further, at 2144 lies the 61.8-percent Fibonacci retracement of the drop between the November 2021 peak of 2459 and the June 2022 trough of 1641.
The daily is extended. In the sessions ahead, what transpires at 2100 will be a big tell. If that breakout was genuine, imminent weakness should attract sufficient buying interest to turn this into a successful retest.
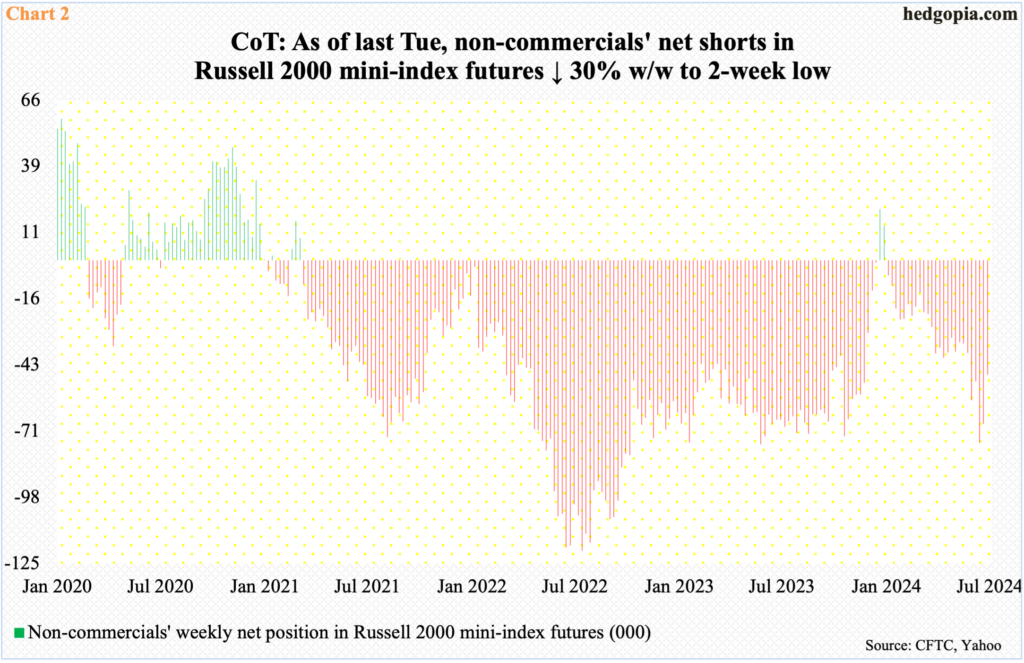
One of the reasons for the latest surge in the Russell 2000 is shorts turning tail.
In the futures market, non-commercials in the week to July 2nd were net short 75,435 contracts in Russell 2000 mini-index futures; this was a 55-week high (Chart 2). In the subsequent week, these traders reduced holdings to 67,626, followed by a reduction of 20,289 to 47,337 in the latest week, which was the week to last Tuesday (16th); this followed the 2100 breakout on the 11th. The 30-percent week-over-week decline in the latest week in non-commercials’ holdings probably contributed to the sharp rally in the cash early last week. We will find out this Friday whether these traders continued to cut back.
Skeptics argue that the jump in the Russell 2000 came too soon, too fast. This in and of itself does not mean the small-cap rally does not have legs to stand on. Plenty a time in the past, such moves have occurred when stocks reach a major bottom. The Russell 2000 – unlike large-cap indices such as the S&P 500 and Nasdaq 100 – remains under its all-time high, which was set in November 2021. For reference, the Nasdaq 100 too bottomed in that month and eclipsed its high last December, before rallying to several new highs; back then, the S&P 500 peaked in January 2022, surpassing that high this January.
Small-caps inherently have a larger exposure to the domestic economy than the large-caps, which also have international exposure. This is why small-caps are often treated as a way to take the pulse of the economy. Investors gravitate toward them when they have high expectations about the economy, which is doing fine but decelerating.
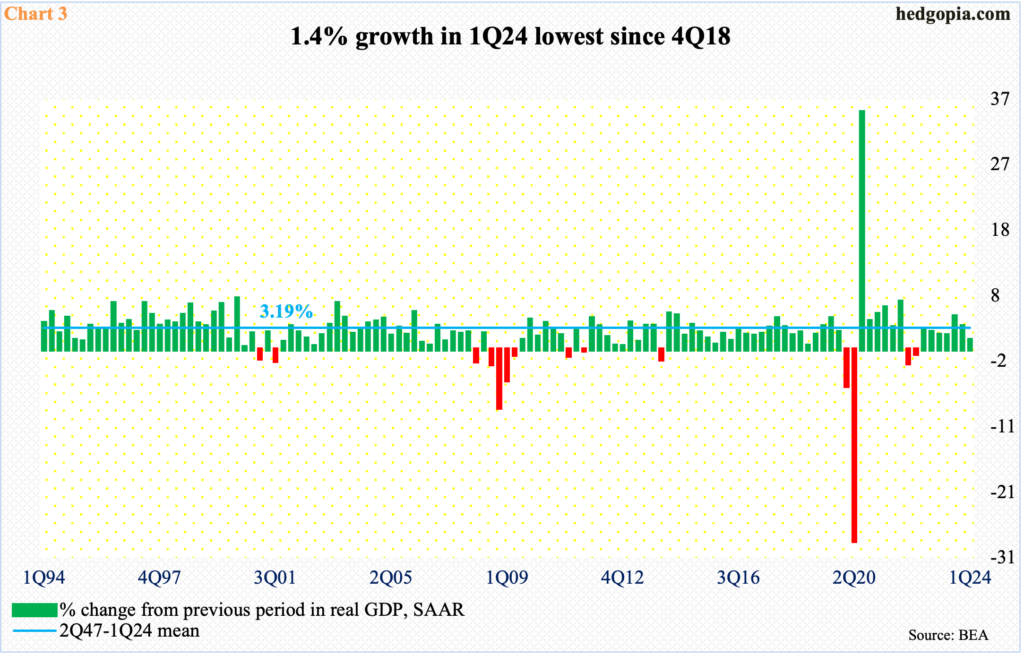
In the March quarter, real GDP grew at an annual rate of 1.4 percent, which was the slowest growth rate since 4Q18 (Chart 3); including the four quarters of negative growth in between, this amounts to 21 quarters.
The deceleration in economic growth, plus the prevailing disinflation trend in consumer inflation, is raising the odds of interest rate cuts. After raising the fed funds rate from between zero and 25 basis points in March 2022 to a range of 525 basis points to 550 basis points last July, the FOMC (Federal Open Market Committee), the Federal Reserve’s rate-setting body, is sending out signals that it is ready for easing.
As a matter of fact, the Russell 2000 began to aggressively rally on the 11th, the same day June’s consumer price index was released. Post-report, futures traders immediately raised their bets on cuts. As things stand, a 25-basis-point reduction in the benchmark rates is baked in for the September (17-18) meeting, followed by another cut in November (6-7), while December (17-18) is a toss-up. By September (23-24) next year, they are betting on the rates to reach between 375 basis points and 400 basis points.
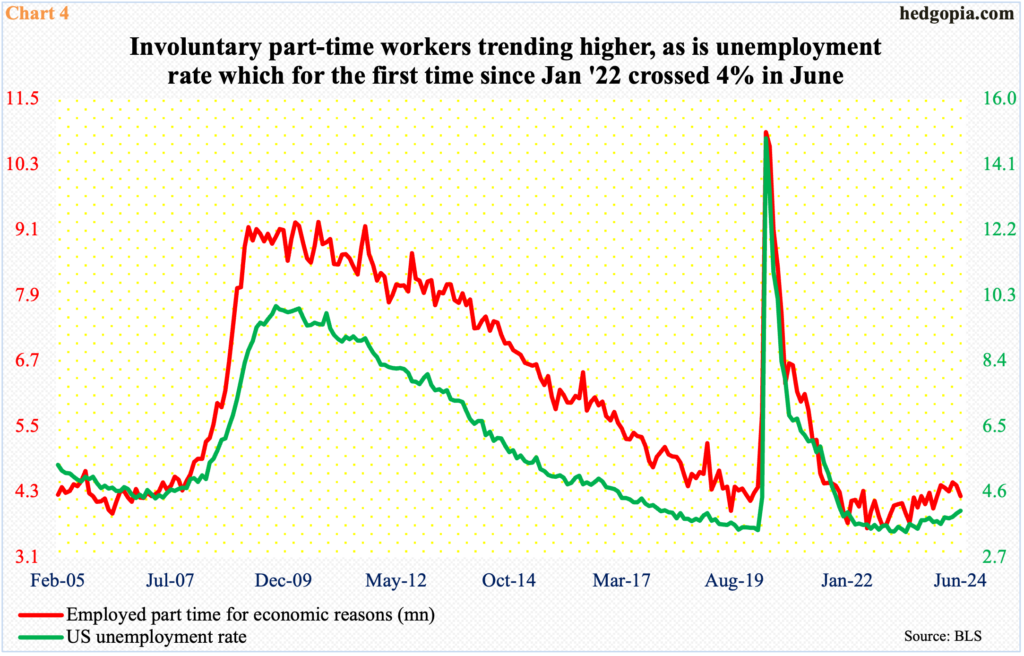
This is aggressive. If the fed funds rate does indeed get there by then, the prevailing goldilocks narrative will have been full of holes. In this scenario, both the unemployment rate and the number of involuntary part-time workers depicted in Chart 4 are likely to be much higher. This will not be an ideal scenario for acceleration in small-cap earnings, which is what is currently expected for 2025.
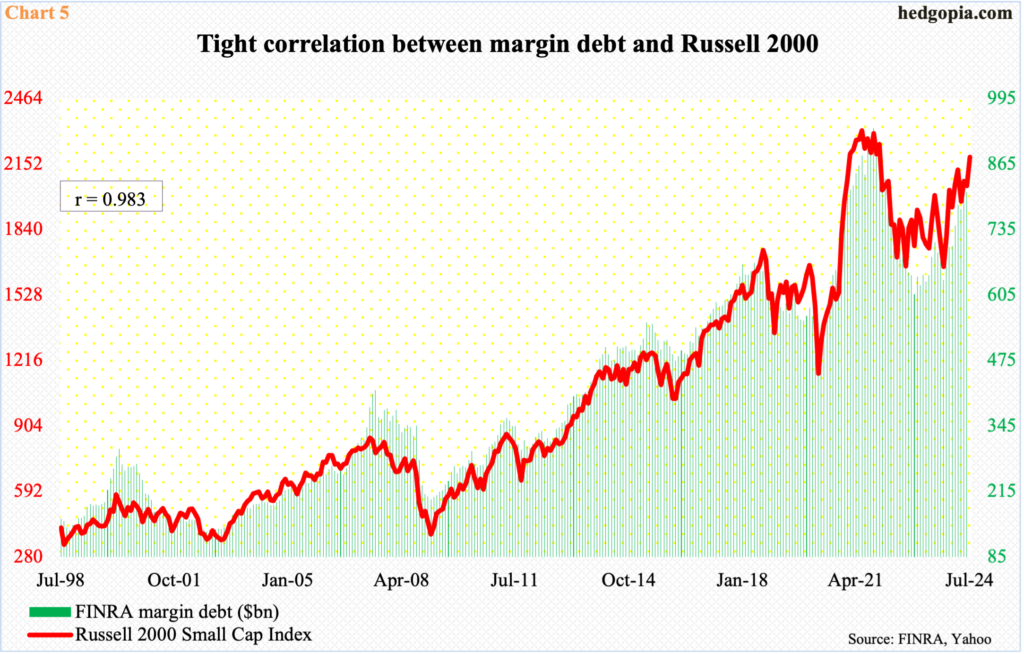
With that said, until 2100 is once again breached, small-cap bulls deserve the benefit of the doubt. One sign as to if the latest buying ignited a pickup in leverage will come when July’s margin debt is reported next month.
The Russell 2000 and FINRA margin debt hold a very tight relationship (Chart 5). In June, margin debt fell slightly, down $109,000 million month-over-month to $809.3 billion. The Russell 2000 was down 1.1 percent last month; in contrast, both the S&P 500 and Nasdaq 100 rose – up 3.5 percent and 6.2 percent respectively.
How margin debt fares in July is likely to tell a tale. If the most recent buyers were building positions with conviction, they would have no trouble in doing so with leverage.
Thanks for reading!

