
At least a section of markets is behaving as if July’s job gains is sustainable, and the US economy is not on the verge of falling apart. The Russell 2000 has scored some technical wins, but the S&P 500 and the Nasdaq 100 remain bound by crucial resistance.
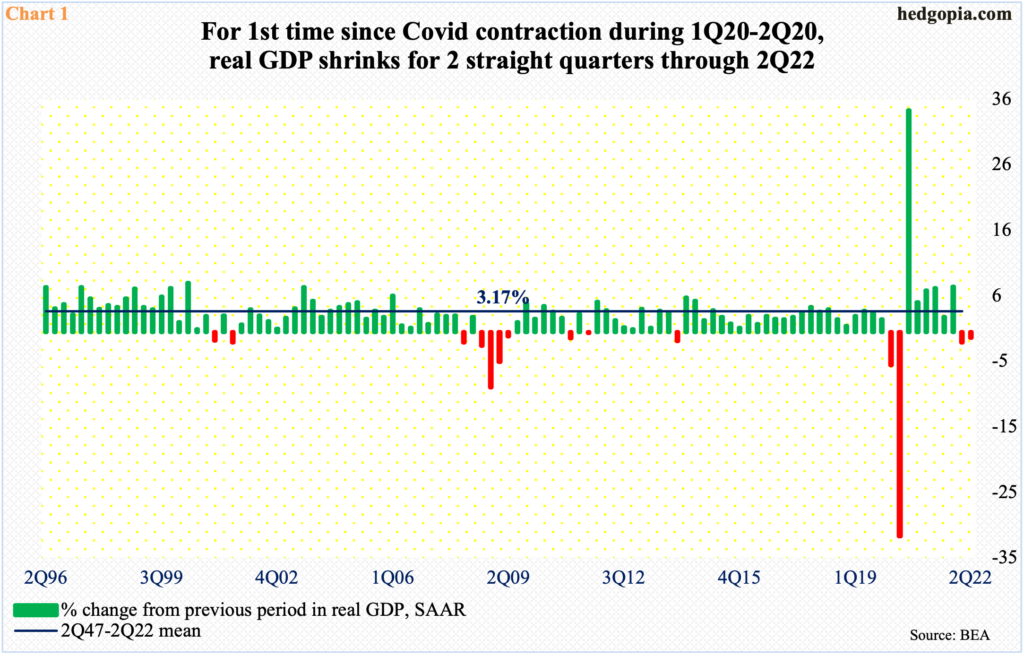
Real GDP just entered a technical recession – defined as two consecutive quarterly drops. In 2Q, the US economy shrank 0.9 percent to a seasonally adjusted annual rate of $19.68 trillion, having peaked at $19.81 trillion in 4Q21. The June-quarter decline was preceded by a 1.6-percent decline in 1Q. This was the first back-to-back contraction since the Covid-caused shrinkage during 1Q-2Q of 2020 (Chart 1).
Despite the two-quarter decline in economic activity, not all the data are in sync. Some would say we are in a recession. Some would say we are not. Small-caps are beginning to bet the economy at least is not falling apart.
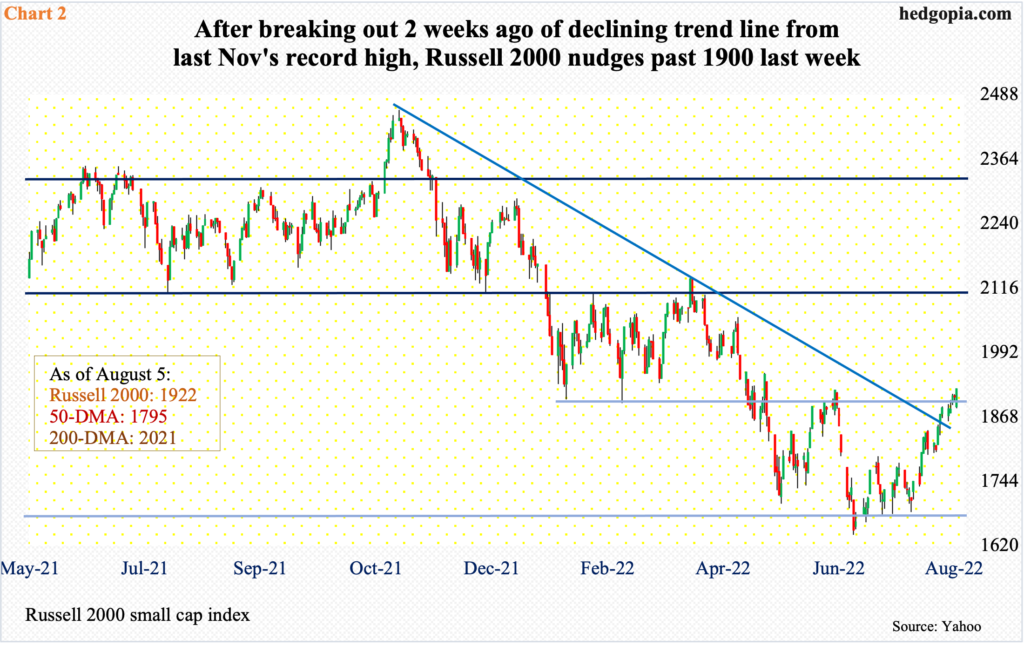
The Russell 2000 peaked at 2459 last November, bottoming at 1641 this June, for a drop of 33.2 percent. Along the way, it breached several supports.
For 10 months, the Russell 2000 went back and forth between 2080s and 2350s before losing 2080s mid-January. It then seesawed between 2080s and 1900, followed by a ping pong match between 1900 and 1700; 1700 is where it broke out of in November 2020. Despite a brief unsuccessful breakout retest, 1700 has held.
After going sideways around 1700 for a month, the small cap index began to rally mid-July. Last week, it poked its head out of 1900; in the preceding week, bulls rallied the index through a declining trend line from last November’s record high (Chart 2).
These are potentially important developments.
Small-caps traditionally are treated as a read on the domestic economy as, unlike large-caps which can have a large overseas exposure, they are heavily exposed domestically. In this regard, the takeout of 1900, if sustained, can prove to be important.
Small-cap bulls’ optimism was vindicated last Friday.
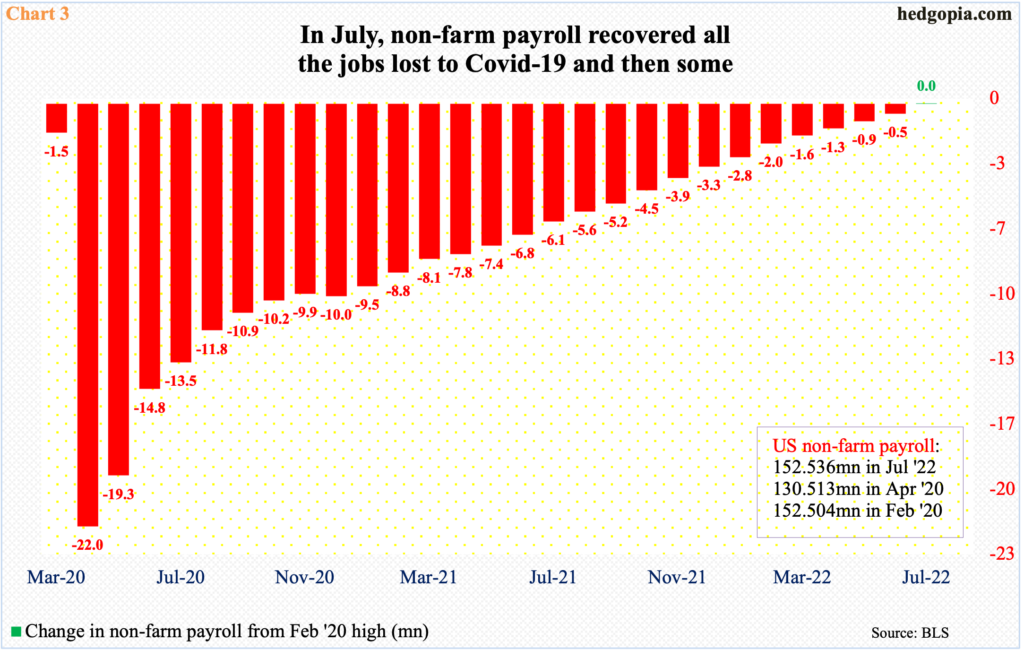
It is one month’s data, but July produced much-better-than-expected 528,000 non-farm jobs. In the first seven months this year, the monthly average has been 471,000, which is much slower than last year’s 562,000. Nevertheless, July’s was a five-month high.
Plus, the economy has now recovered all the jobs lost due to Covid-19. In February 2020, non-farm jobs peaked at 152.504 million; by April, the series sank to 130.513 million, for a loss of 22 million jobs. This July, a new peak of 152.536 million has been achieved, surpassing the prior high by 32,000 (Chart 3).
July’s jobs data is probably music to the Federal Reserve’s ears.
Stuck between a rock and a hard place, the central bank is attempting to push consumer inflation significantly lower yet keep the economy humming at a sustainable pace.
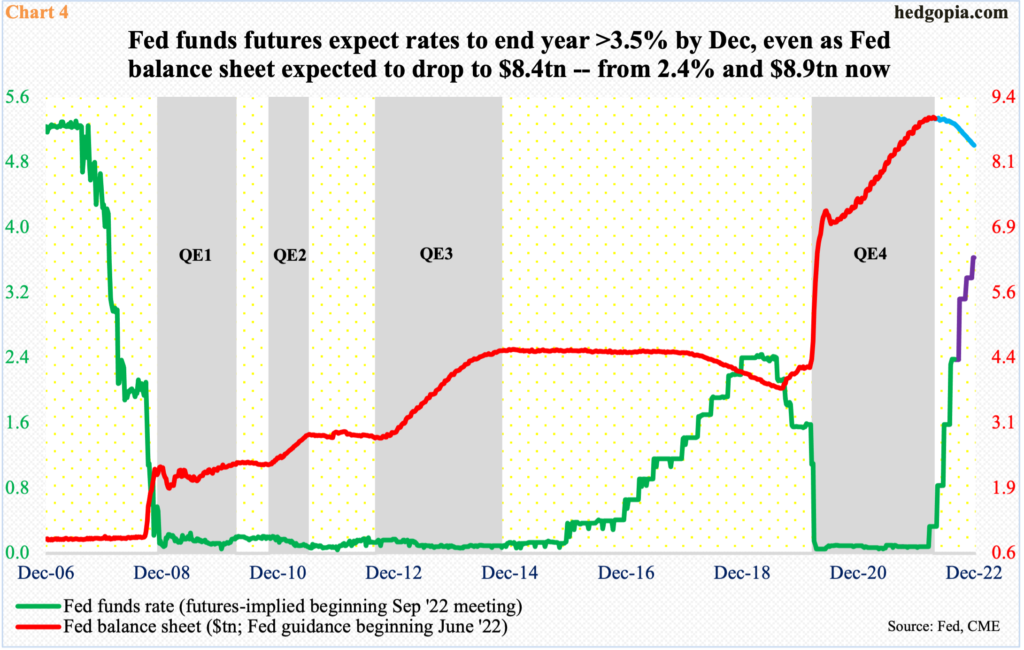
It has so far raised four times in the current tightening cycle – by 75 basis points each in July and June, 50 basis points in May and 25 basis points in March, to a range of 225 basis points to 250 basis points. In the futures market, traders anticipate the fed funds rate to end north of 350 basis points by December. Concurrently, the Fed is reducing its bloated balance sheet (Chart 4).
July’s jobs data shows the economy has far from screeched to a halt. At least not yet. It is too soon to say how the remaining hikes in the coming months will impact the economy once they start filtering through the system.
So, it is prudent not to take the message from small-caps at face value. The signal they are telegraphing has positive vibes to it but will have significantly gained significance if seconded by large-caps, including tech.
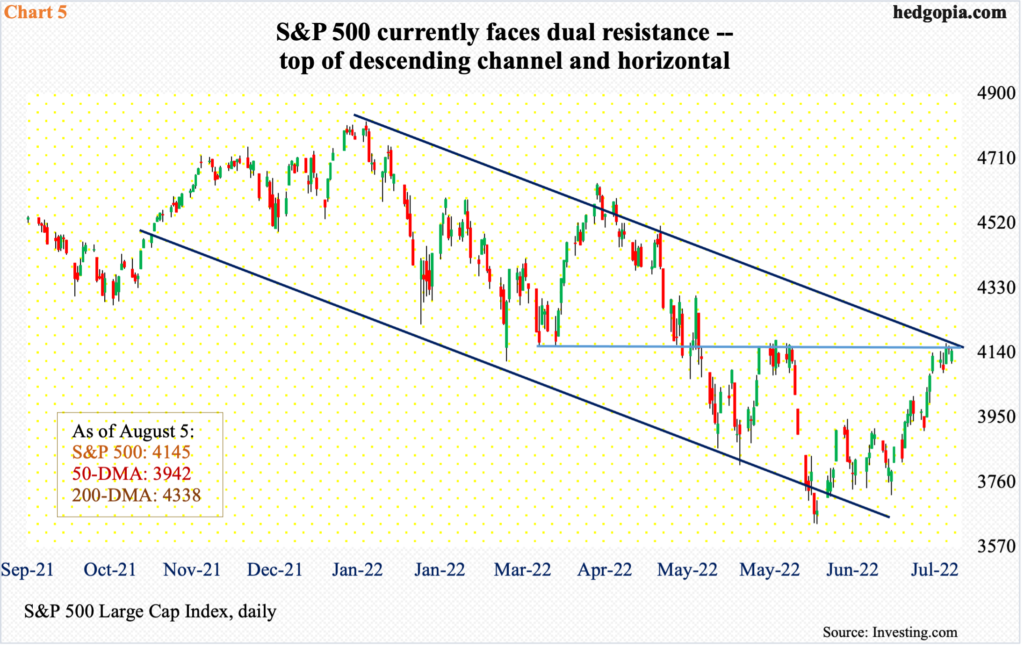
The S&P 500 dropped 24.5 percent between January and June this year. After a month of consolidation, the large cap index has rallied strongly since mid-July and has reached crucial juncture.
The index (4145) currently faces horizontal and trend-line resistance at 4150s (Chart 5). The daily is getting way extended, but a push through this roadblock can entice more buying.
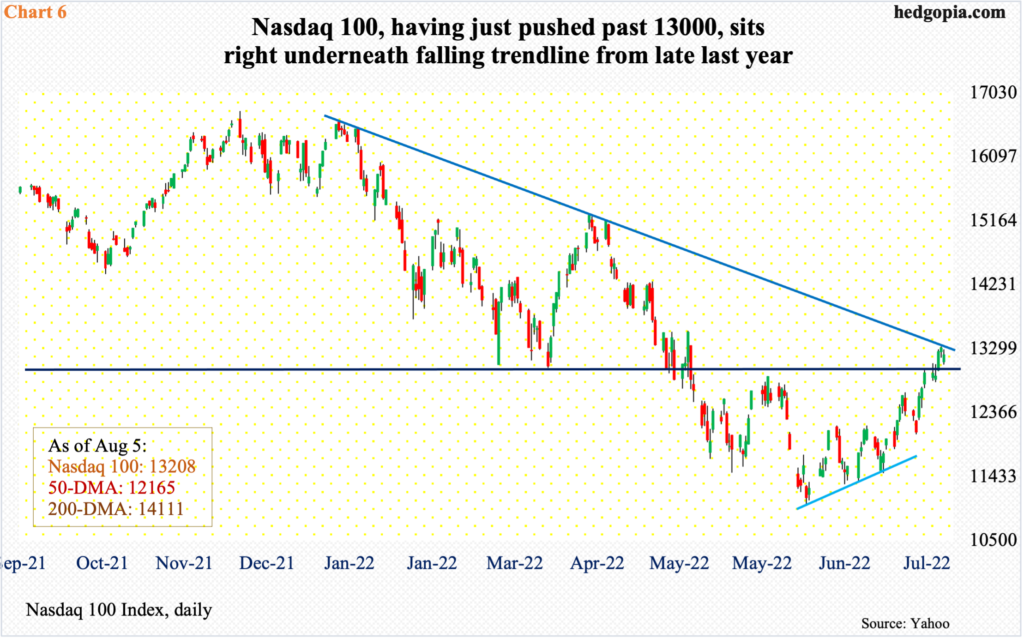
The Nasdaq 100 similarly sits at an interesting spot.
The tech-heavy index (13208) tumbled 34.2 percent between last November’s record high 16765 and the June 16 low of 11037. From that low, it persistently made higher lows and began to lift off mid-July.
On the monthly, several indicators just turned up from oversold territory. Near-term, though, the Nasdaq 100 sits overbought on the daily and is running against crucial resistance.
Last week, straight-line resistance at 13000 was reclaimed, but not the trend-line resistance from last November’s – or December’s – highs (Chart 6); Thursday’s intraday high of 13327 just about tested this potential roadblock.
Depending on how these two indices act in the sessions ahead and if their respective resistance levels give way – or how this process evolves – will say a lot about the sustainability of the recent positive action in the Russell 2000.
Thanks for reading!
