The ongoing selloff in equities has been quick and painful – similar to what transpired in February this year. Back then, once stocks bottomed, they proceeded to rally strongly. Will the current selloff evolve the same way? Too early to tell. Although odds favor at least a decent reflex rally given how oversold several indicators are.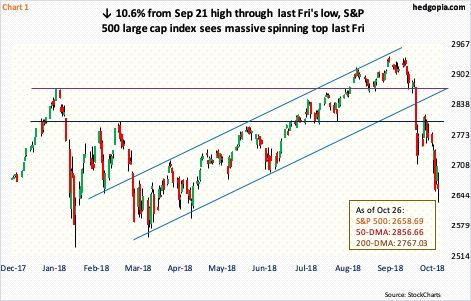
The severity of the ongoing selloff in US stocks is comparable to the one seen in February this year. Back then, between January 26 and February 9 intraday, the S&P 500 large cap index fell 11.8 percent. This time around, from intraday high to low between September 21 and October 26, it dropped 10.6 percent (Chart 1).
Hindsight is always 20/20, but the February low turned out to be a great time to go long. Off of that low through the all-time high of 2940.91 reached on September 21, the S&P 500 jumped 16.1 percent. Would the current selloff represent a similar opportunity? Time will tell.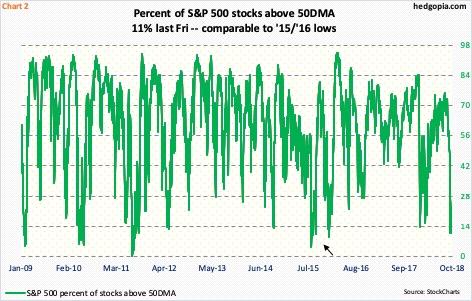
Bulls do have the advantage of oversold indicators, some of them severely.
Take the percent of S&P 500 stocks above the 50-day moving average. Last Friday, it dropped to 11 percent. This is lower than the 13.6 percent hit on February 9 this year. In fact, the current reading is not that far away from the lows of late 2015/early 2016 (arrow in Chart 2). Back then, only 4.6 percent were above the 50-day in September 2015 and nine percent in January 2016. The S&P 500 reached a major low in February 2016. This is just one example. Several other metrics are at similar oversold levels, if not worse.
Importantly, during the February selloff this year, bulls defended the 200-day. Not so this time around. The average was lost 12 sessions ago, only to be recaptured within a few sessions, but the rally petered out at horizontal resistance at 2800. This area also represents the underside of a broken February 2016 rising trend line. Hence its significance.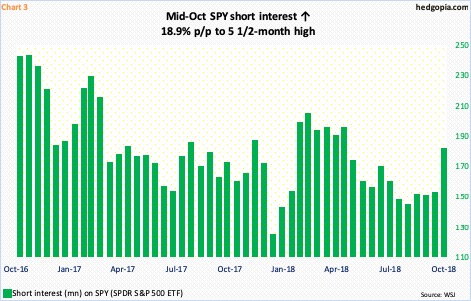
The thing is, just to go test the 200-day, the S&P 500 now needs to rally 4.1 percent, and 5.3 percent to test 2800. As mentioned earlier, in the week before, the latter resistance was tested – unsuccessfully. In the event of a test near term, odds favor shorts once again get active around this level. At the same time, should a breakout occur, they likely reduce their exposure. In the latter scenario, short squeeze is a possibility.
In the October 1-15 period, short interest on SPY (SPDR S&P 500 ETF) jumped 18.9 percent period-over-period to a five-and-a-half-month high (Chart 3). Even in this scenario, longs are not going to get much help from short squeeze. The mid-October count of 180.3 million is lower than the end-February (this year) reading of 203.9 million, and much lower than the mid-January 2016 level of 318.2 million.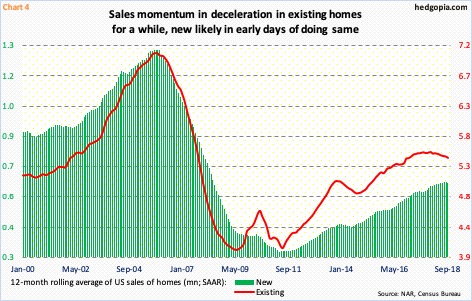
In the present context, the advantage shorts have is this. US macro data – most of it anyway – are too strong currently for their own good. The first estimate – published last week – showed real GDP grew at a seasonally adjusted annual rate of 3.5 percent in 3Q18. This represents deceleration from the 4.2-percent pace in 2Q18, but is strong historically. Post-Great Recession, the economy expanded at an average 2.3 percent, and at 3.2 percent going all the way back to 2Q47. The current numbers are goosed by last December’s tax cuts as well as the subsequent fiscal stimulus. This is not sustainable.
The ISM manufacturing index looks the same way. Manufacturing activity in September fell 1.5 points month-over-month to 59.8. August’s 61.3 was the highest since 61.4 in May 2004. Historically, readings north of 60 are hard to hold.
Or take housing, for that matter. Arguably, the sector is stagnant at best and falling apart at worst.
In September, sales of existing and new homes respectively fell 3.4 percent and 5.5 percent m/m to 5.15 million and 553,000 units. They have been dropping since last November when they peaked at 5.72 million and 712,000 units, in that order. Chart 4 calculates the 12-month rolling average of sales, and the trend is crystal clear. Existing homes are clearly rolling over, even as new ones seem to want to do the same.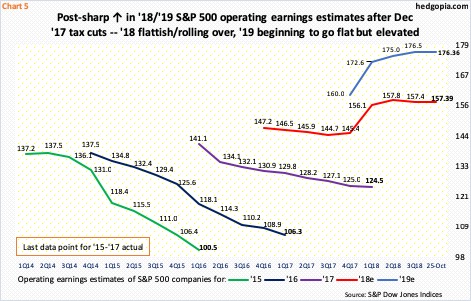
Growth deceleration is bound to reverberate through a whole host of issues, not the least of which is corporate earnings. Currently, sell-side expectations for next year in particular are elevated.
Operating earnings estimates for S&P 500 companies for this year took off in the wake of the signing of the Tax Cuts and Jobs Act of 2017, which became law on December 22 last year. As of December 21, this year’s estimates were $145.31, which by July 26 rose to $158.24. As of last Thursday, they were $157.39. Similarly, 2019 estimates currently stand at $176.36, slightly down from the high of $177.13 as of August 3. For reference, these companies earned $124.52 in 2017.
Chart 4 uses quarter-end estimates, hence do not reflect week-to-week swings. Nonetheless, 2018 is already showing a revision trend of flat to slightly down; 2019 is holding up, although estimates seem to be flattening out. In a scenario in which economic growth softens, next year’s estimates are vulnerable. Not to mention a plethora of other issues ranging from a strong dollar to higher interest rates to higher oil prices to the possible adverse effects of tariffs. Managements are voicing these concerns in 3Q18 earnings calls.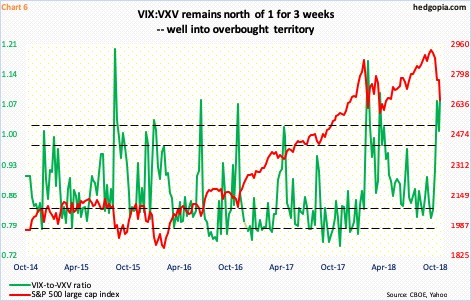
Is this what markets are beginning to price in? Too early to tell. But this is definitely something to keep on the back of one’s mind. Risks are beginning to rise medium- to long-term. Near term, it is probably the opposite. At least a relief rally is the path of least resistance. It is even possible a good rally unfolds in the seasonally strong November and December before things fall apart early next year.
For now, the S&P 500 continues to trade along a sharply falling daily lower Bollinger band, with some signs of indecision beginning to crop up. Last Friday produced a spinning top, with really long upper and lower shadows. Of note, even as major indices dropped to fresh lows last week, VIX did not surpass the October 11th intraday high of 28.84. Also last Friday, VIX closed down 0.3 percent, even as the S&P 500 fell 1.7 percent! This is rare.
On a related note, the VIX-to-VXV ratio closed Friday at 1.08 (Chart 6), with a reading of 1.12 Wednesday. This is way elevated, and needs to unwind. As premium comes out of VIX faster than VXV, investors gravitate toward risk-on. This bodes well for equities.
This brings into focus the SPY October 26th 275 short put hypothetically initiated on October 15. A premium of $3.78 was taken. With the underlying closing last Friday at $265.33, the position will be put. It is an effective long at $271.22. Worth staying put.
Thanks for reading!

