
Presently, the state of US trade deficit and how the Trump administration is attempting to address it is front and center.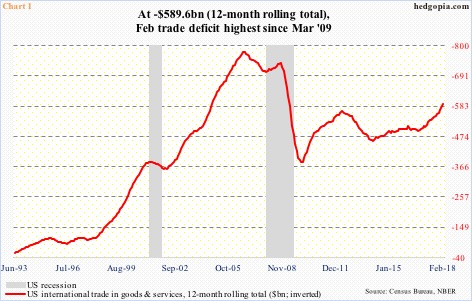
In February, the deficit came in at $57.6 billion, with the 12-month total of $589.6 billion, which was the highest since March 2009 (Chart 1). China – a manufacturing hub – is a big part of this. The Administration is trying to remedy the situation through imposition of tariffs.
On March 1, Trump promised 25-percent tariffs on steel imports and 10-percent on aluminum imports. US stocks fell in that session (Thursday) and again early in the next session before buyers showed up. Late Tuesday last week, the president announced 25-percent tariffs on $50 billion worth of Chinese imports. Wednesday, stocks opened down but that weakness was bought. Less than 12 hours after the tariff announcement, China issued a list of US products worth $50 billion for possible tariff hikes. Then on Thursday, Trump proposed $100 billion in additional tariffs against China. Markets did not take this nicely. Major US equity indices fell north of two percent on Friday. If the US releases a list of $100 billion worth of tariffs, China in all likelihood will follow suit.
Where is this headed? Is what looks like a skirmish right now on its way to evolving into a war? More importantly, were stocks looking for a reason to sell off anyway and the trade dispute just became an excuse?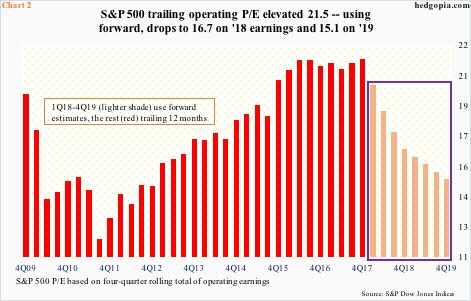
The S&P 500 large cap index peaked on January 26 at the all-time high of 2872.87. From that peak through the intraday reversal low of 2532.69 on February 9, it then collapsed 11.8 percent. We are talking 11 sessions peak to trough! The selloff began well ahead of tariff imposition.
The bull market in US stocks is in its 10th year. Multiples accordingly have persistently risen. As a matter of fact, using trailing 12 months of operating earnings through 4Q17, the S&P 500 traded at 21.5x. This is expensive. The price-to-earnings ratio drops using forward estimates, but the question then becomes one of reliability.
Post-tax cuts, the sell-side promptly raised estimates. As of December 21, they expected $145.31 for this year. The Tax Cuts and Jobs Act of 2017 was signed into law on December 22. As of last Thursday, 2018 estimates were $155.86, and 2019 $172.28. These companies earned $124.52 in 2017.
Using forward estimates, the P/E drops, but 2018 is still 16.7x and 2019 15.1x – not cheap by any stretch of the imagination (Chart 2). Therein lies the bulls’ dilemma – continue to stay or lock in profit?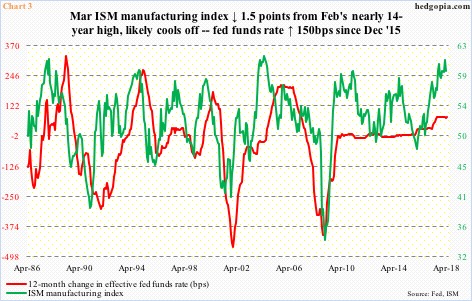
There is a similar phenomenon in play when it comes to the economy. Three months short of completing nine years, the recovery arguably is long in the tooth. The tax cuts and fiscal stimulus will help, but concurrently rates have gone up. Since December 2015, the fed funds rate has been raised by 150 basis points to a range of 150 and 175 basis points. The FOMC dot plot expects two more hikes this year.
In the meantime, manufacturing activity remains elevated. The ISM manufacturing index fell 1.5 points month-over-month in March. February’s 60.8 was the highest since May 2004. Readings north of 60 are rare (Chart 3). It is only natural that activity softens. Particularly considering the backup in rates.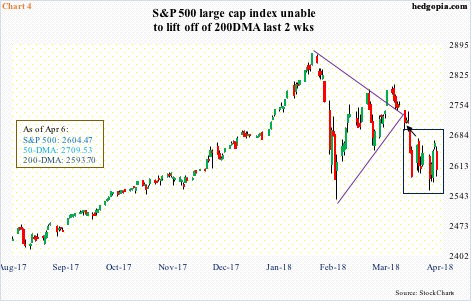
Looking at how major equity indices have traded since peaking late January, it seems at least some bulls have left. The speed at which stocks were sold in February and the way they have struggled since are signs that the resultant offers are not being met with sufficient bids.
Thus the struggle to save the 200-day moving average on the S&P 500, for instance. When the average was tested in February, the index bounced right back up. This time around, it has hovered around that average for two weeks now (dark blue box in Chart 4).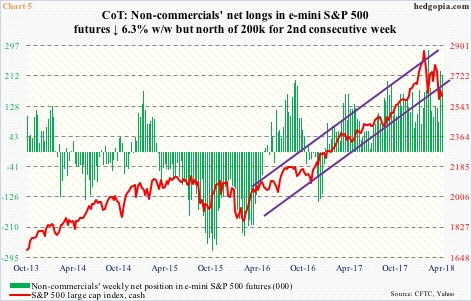
This action is particularly interesting given the aggression shown by non-commercials in the past couple of weeks.
In the week ended March 20, these traders held 83,293 net longs in e-mini S&P 500 futures. The cash closed at 2716.94 in that session (arrow in Chart 4). A week later, their holdings had shot up to 226,803, which then fell slightly to 212,603 last Tuesday. Throughout this buildup, the cash pretty much traded near the 200-day, unable to lift off.
It is possible non-commercials’ bullish aggression met with an offset somewhere else. Between March 21 and last Thursday, SPY (SPDR S&P 500 ETF), VOO (Vanguard S&P 500 ETF) and IVV (iShares core S&P 500 ETF) combined saw outflows of $21.3 billion (courtesy of ETF.com). Likewise, in the three weeks ended last Wednesday, US-based equity funds (including ETFs) suffered redemptions of $35.6 billion (courtesy of Lipper.com).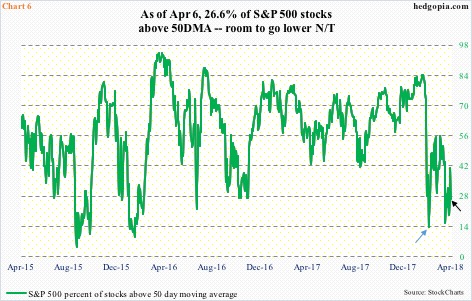
So where to from here?
A case can be made that the 200-day will be violated near term. On the daily chart, several momentum indicators have turned lower from the median. Ditto with the percent of S&P 500 stocks above the 50-day. As of last Friday, 26.6 percent of stocks were above that average. On February 8, this stood at 13.6 percent, and then at 15.6 percent on March 23. This metric has room to go lower near term.
In this scenario, an equally strong case can be made that once stops get taken out post-loss of the 200-day, the bulls will step up or the bears will step aside, particularly if the February 9 intraday low is not breached. First-quarter earnings season begins in earnest this week.
This likely offers another opportunity to at least earn some premium in the options market. Hypothetically last week, weekly (April 6) SPY 261 puts were sold for $2.16. With the underlying closing Friday at $259.72, the short put will get assigned with an effective cost of $258.84. A closure nets $0.88.
Again hypothetically, weekly SPY Apr 13 258 puts are going for $2.34. These are naked puts, thus can be assigned, as was the case last week. If so, it is a long at $255.66. For this to be a loser, SPY needs to drop more than 1.6 percent this week. Else, the premium – either all or some – is kept.
Thanks for reading!
