Equities failed to rally last Wednesday, when the FOMC handed out a jumbo 50-basis-point cut. Stocks had a very nice session on Thursday. With that said, the last three daily candles on the S&P 500, which did rise to a new high, have anything but developed strong conviction about continuation of positive momentum near-term.
The Federal Open Market Committee’s easing action – the first since August 2019 – last Wednesday reverberated through a whole host of assets. The fed funds rate was cut by 50 basis points to a range of 475 basis points to 500 basis points. The benchmark rates were left unchanged at 525 basis points to 550 basis points from July last year. Earlier, the FOMC began tightening in March 2022, having left the rates zero-bound between zero and 25 basis points for a couple of years.
In response to the beginning of an easing cycle, gold broke out to a new high last week. The US dollar index continued its downtrend – down in 10 of the last 12 weeks – and is desperately clinging on to crucial support at 100-101. The S&P 500 broke out to a new high, and rather oddly, the 10-year treasury yield rose.
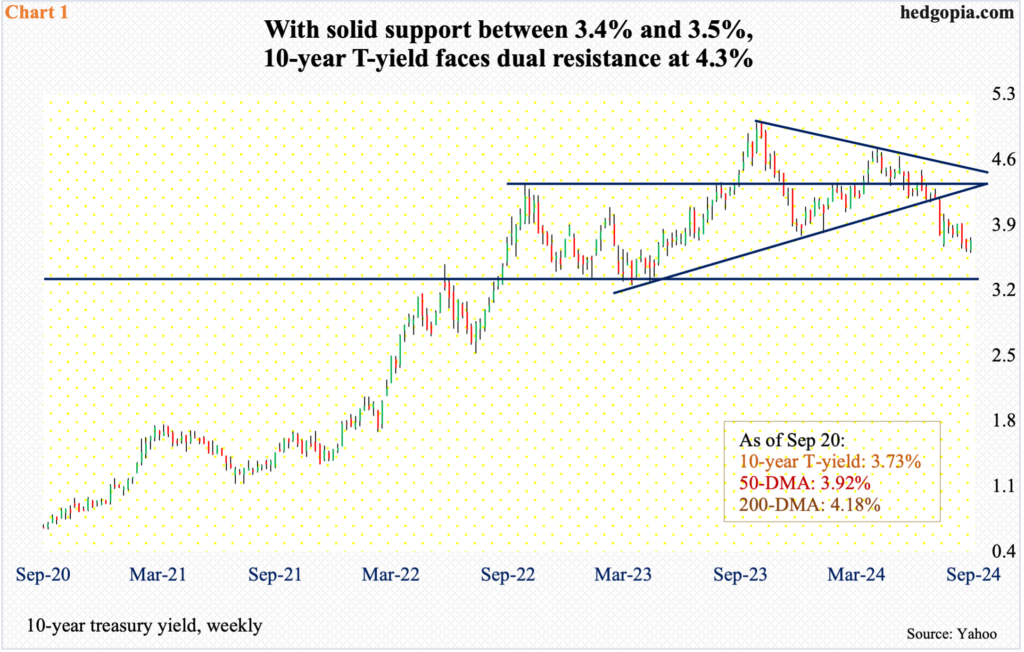
The 10-year had been under pressure since peaking at five percent last October, with a lower high of 4.74 percent in April. Horizontal support at 4.3s was breached in July, followed by a loss in August of a rising trend line from April last year when the 10-year bottomed at 3.25 percent.
Last Tuesday, the 10-year ticked 3.6 percent intraday before reversing higher, ending the week up eight basis points to 3.73 percent. There is lateral resistance just under 3.8 percent. Once this gets taken out in the sessions/weeks ahead, trendline resistance from April last year rests at 4.3 percent, which also coincides with horizontal resistance (Chart 1).
Should the 10-year continue its downtrend, it is unlikely the lateral support between 3.3 percent and 3.4 percent breaks right away.
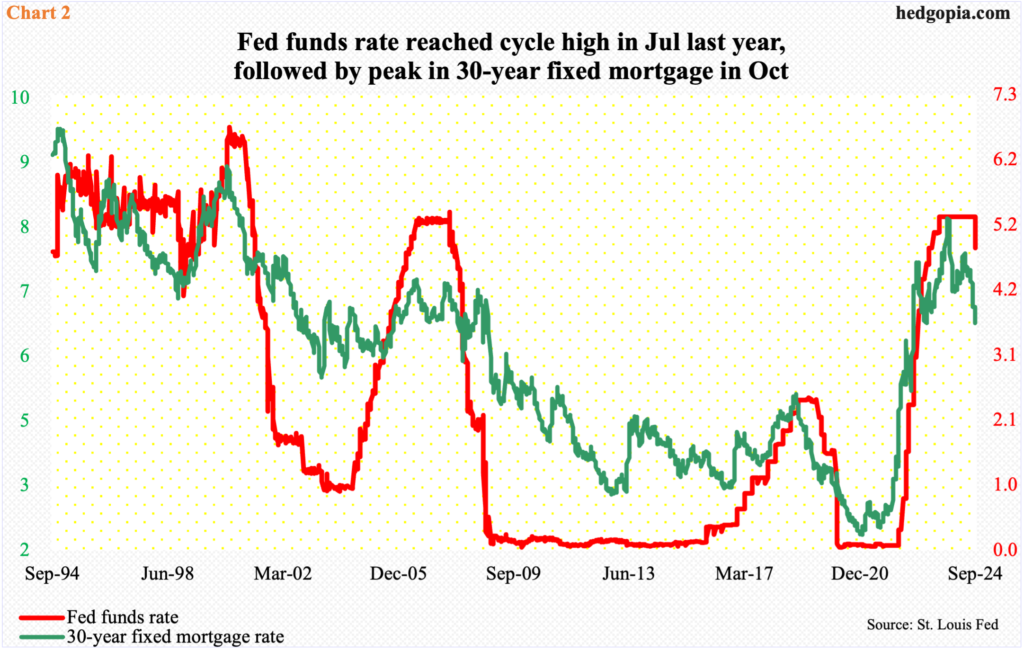
If the 10-year rallies here, it would arguably defeat the purpose of the Federal Reserve’s move to lower the short-term rates. The 30-year fixed mortgage rate, for instance, is priced off the 10-year, not the fed funds rate.
Both the 10-year treasury yield and the 30-year fixed mortgage rate reached their highs last October, with the latter peaking at 7.8 percent. The fed funds rate stopped going up in July last year and was not lowered until last week. The long end of the yield curve and the 30-year mortgage rate kept going lower. The 30-year fixed mortgage rate ended last week at 6.1 percent (Chart 2) and will rally in the event the 10-year comes under upward pressure – magnitude and duration notwithstanding.
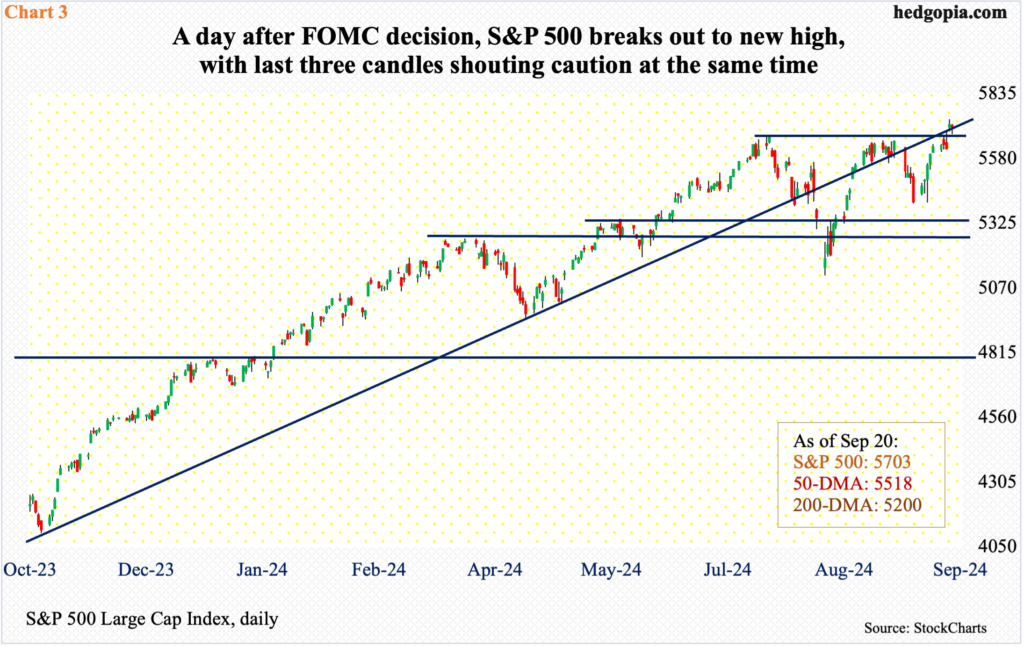
It was probably this action in the bond market on Wednesday – the day the FOMC decision was made public – equities were unable to cling on to their highs in that session. The S&P 500 rallied as high as 5690 but only to reverse hard and end Wednesday at 5618. Cooler heads prevailed Thursday when the large cap index jumped 1.7 percent to 5714, with an intraday high of 5734, forming a spinning top. This comes immediately after Wednesday’s shooting star and ahead of Friday’s hanging man (Chart 3).
On Friday, the S&P 500 dropped as low as 5674, which was bought, ending the session down 0.2 percent to 5703; the low of the session happened near the prior two highs – 5670 on July 16 and 5671 last Tuesday. From the bulls’ perspective, this is a successful retest of the breakout. That said, the last three candles that urge caution – Wednesday’s shooting star, Thursday’s spinning top and Friday’s hanging man – deserve respect until proven otherwise.
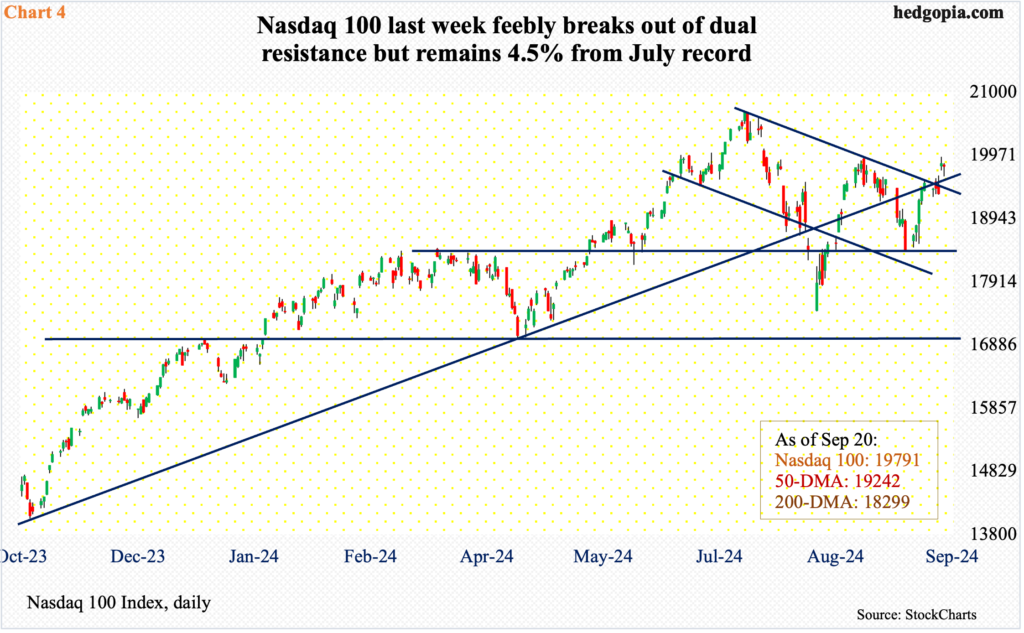
Over on the Nasdaq 100, the same three candles formed in the last three sessions last week. Unlike the S&P 500 which just printed a new high, the Nasdaq 100 (19791) is still 4.5 percent from its all-time high from July (Chart 4).
Investors are no longer fascinated by tech as they were until not too long ago. Last week, the Nasdaq 100 did manage to eke out a breakout at dual resistance – falling trendline from the July high and broken rising trendline from last October’s low – but action looks tentative.
As things stand, Thursday’s intraday high of 19952 holds importance for bulls and bears alike.
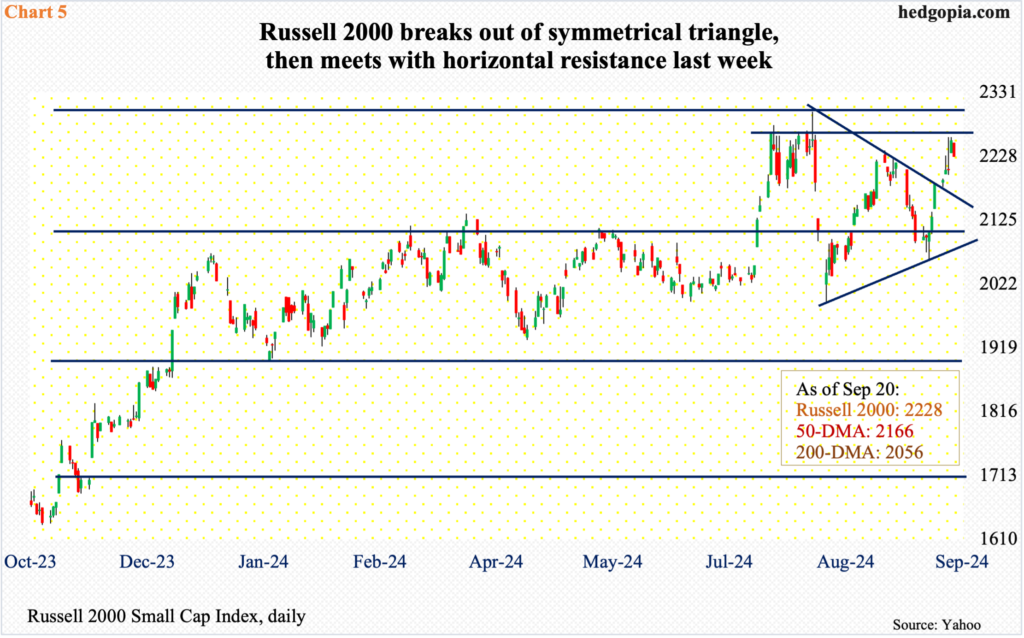
On the Russell 2000, 2260s hold the key. As a matter of fact, on both Wednesday and Thursday it ticked 2259 intraday but was unable to take out the resistance. Horizontal resistance at 2260s goes back to mid-July (Chart 5).
Before facing resistance at 2260s, the small cap index broke out of a month-and-a-half symmetrical triangle as early as Monday, as the FOMC was getting ready to lower the benchmark rates. Small-caps inherently have more domestic exposure than their large-cap cousins. The index also contains quite a few regional and community banks which will benefit from lower rates, not to mention the leveraged ones.
Viewed this way, the Russell 2000’s 2.1-percent rally last week should be viewed as subdued. The index has rallied nicely of late, but until 2260s are decisively won over, it is hard to build on that momentum.
Thanks for reading!

