
After President Donald Trump won the election last November, U.S. bonds and stocks had a massive positive reaction. The former sold off, the latter rallied.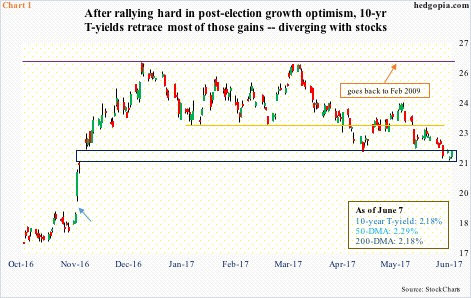
On November 8 (election day), TLT, the iShares 20+ year Treasury bond ETF, closed at 128.15. By December 16, it dropped intraday to 115.29.
Between the periods, 10-year T-yields went from 1.86 percent to 2.62 percent (Chart 1).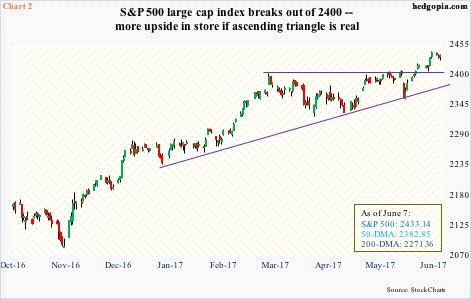
Similarly, the S&P 500 large cap index rallied from 2139.56 on November 8 to last Friday’s intraday high of 2440.23, up 14 percent.
Investors/traders latched on to the promises of infrastructure spending, tax cuts, and regulatory relief.
Fast forward to now, at least bonds are having second thoughts.
Post-election, after rallying hard for five weeks, 10-year yields retreated from 2.62 percent. Resistance at that level goes back to February 2009 (Chart 1). To get over this hurdle, it would take a lot to convince bond vigilantes that the economy was on the verge of acceleration.
Come mid-March, that resistance was tested again – unsuccessfully. The post-election spike in soft data such as the NFIB small-business survey and consumer sentiment was not getting translated into hard data.
Tuesday, yields dropped to 2.13 percent intraday, in the process filling one of the two gaps last November (blue rectangle in Chart 1). (The other one is denoted by light blue arrow.) It is possible yields rally further – if nothing else just to unwind oversold conditions. But the overall message the long end is sending is not that of growth acceleration.
Equities beg to differ.
True, the rally is led by large-caps, with lackluster small-cap participation, particularly this year. But as noted above, the S&P 500 just made a new all-time high. After going sideways for nearly three months, it has managed to break out of 2400.
If the break out of the ascending triangle seen in Chart 2 is real, there is more upside left.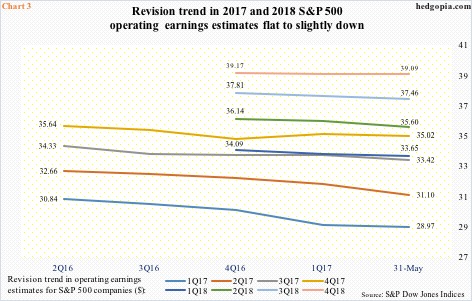
They cannot both be right.
The high hopes priced into stocks post-election needs to be confirmed by a breakout in yields. If the bond market does not concur, then in due course the optimism reflected in Chart 3 remains just that – optimism.
In 2016, S&P 500 companies earned $106.26 in operating earnings, up from $100.45 in 2015. This year, the sell-side expects $128.52, and $145.80 next year.
In January last year, 2017 was expected to come in at $141.11. So the revision trend is down for 2017. That said, 2018 estimates are holding up. In January this year, 2018 was $147.21.
Chart 3 plots 2017 and 2018 estimates by quarter, with 2018 estimates in particular essentially flat.
This is where bonds and stocks are in disagreement. The former is essentially saying there is no way these estimates come through.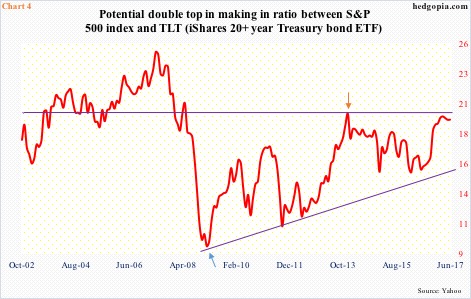
In this respect, there is potentially a message coming from Chart 4.
The red line is a ratio between the S&P 500 and TLT. It bottomed in February 2009 (blue arrow). Stocks bottomed in March that year. The uptrend is still intact. Nonetheless, the ratio is at a critical juncture.
In December 2013, it made an important high (orange arrow), which was just about tested this March – so far unsuccessfully. Unless things reverse pretty soon, in due course it could be headed toward testing the rising trend line. In this scenario, at least some of the optimism built into the S&P 500 comes out.
Thanks for reading! Please share.
