
After a big rally in recent months, 10-year Treasury yields are giving out signs of fatigue – at least near term.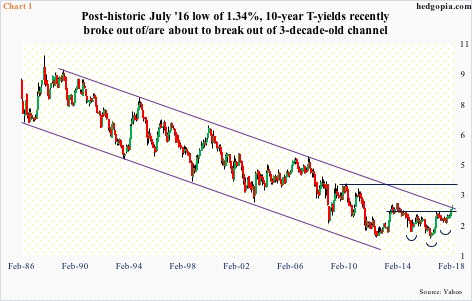
Interest rates have suddenly become the talk of the town.
Ten-year yields rallied from 2.03 percent on September 7 last year (black arrow in Chart 2) to last Thursday’s intraday high of 2.93 percent. Amid a rise in inflation worries, the bond market is on pins and needles as to if yields will surpass three percent and if that would entail portfolio allocation – not just in bonds but across assets.
Three percent on the 10-year is a level not seen since January 2014. It is also a level representing the top of a three-decade-old descending channel (Chart 1). Depending on how one draws a line, yields have either already broken out – although just barely – or about to.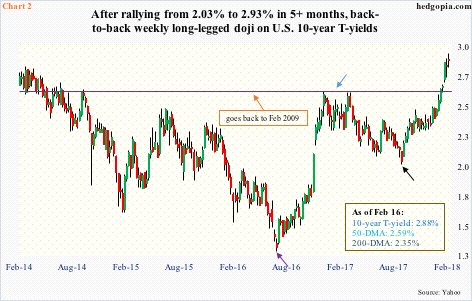
Either way, they have come a long way, having reached a historic low of 1.34 percent in July 2016 (violet arrow in Chart 2). Along the way, yields broke out of 2.60-2.62 percent mid-January this year. This resistance goes back to February 2009, and was also a level bond bulls (price) defended in December 2016 and March 2017 (blue arrow in Chart 2). It gave way last month.
With that, the neckline of a potential reverse-head-and-shoulders pattern has been broken. If it is a genuine breakout and the pattern completes, technicians in due course would be eyeing 3.9 percent (Chart 1). By that time, yields would have cleanly broken out of the channel.
Here is the thing, though.
Since 2.60-2.62 percent fell last month, a retest has yet to occur. Breakout retest does not always have to occur, but in this case one may be forthcoming.
Yields have come under slight pressure since last Thursday’s peak. Last Friday, the 10-day moving average was defended, but a long-legged doji developed in the session. Ditto with the weekly chart, which produced a long-legged doji back-to-back the last couple of weeks (Chart 2).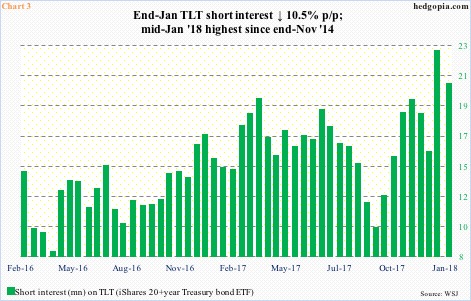
In a scenario in which yields come under pressure – duration and magnitude notwithstanding – bond bears can potentially help the bulls. Fuel for squeeze is building.
End-January short interest on TLT (iShares 20+year Treasury bond ETF) dropped 10.5 percent period-over-period to 20.5 million, but the prior period was the highest since end-November 2014.
Most recently, short interest bottomed at 10 million at the end of September last year. TLT peaked at $128.05 on December 15, before dropping to $117.47 last Wednesday (Chart 5).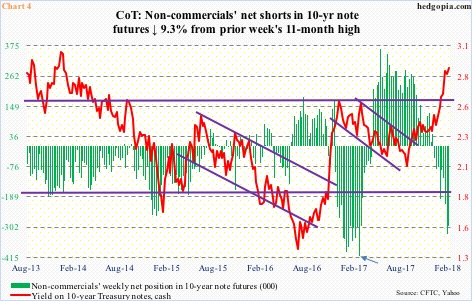
Similarly, in the futures market, non-commercials have built up a decent amount of net shorts in 10-year note futures. Last Tuesday, their holdings fell 9.3 percent week-over-week to 296,935 contracts. The prior week’s total – 327,540 contracts – was an 11-month high.
A year ago, these traders held record net shorts – peaked at 409,659 contracts (the week ended February 28). Then they got squeezed (arrow in Chart 4). On March 13 last year, 10-year yields failed to take out 2.62 percent, subsequently dropping to 2.1 percent by mid-June and 2.03 percent by early September.
Could they get squeezed again?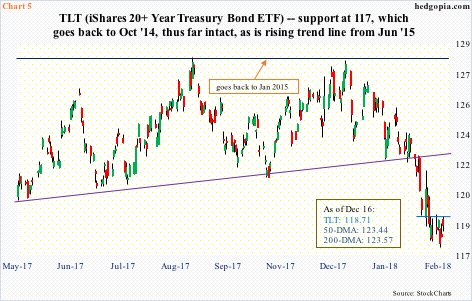
As stated above, 10-year yields are giving out signs of fatigue, and a breakout retest (2.60-2.62 percent) is possible.
In the meantime, TLT ($118.71) is trying hard to bottom. There is short-term resistance at $119.20, which rejected last Friday’s rally attempts.
Last week produced a weekly spinning top on TLT, with the weekly low matching the low of May 2017. This also represented a successful test of a rising trend line from June 2015. Support at 117-plus goes back to October 2014. So long as this level holds, odds favor bond bulls near term.
But it is hard to imagine the ETF put up a strong rally right away. The daily chart just had a 50/200 death cross. The 20-day is still dropping. But the 10-day is beginning to go flattish. A lot will depend on what happens at 2.60-2.62 percent on the yield front.
A buy write – long underlying combined with short call – is just the right recipe in a time like this. Hypothetically, weekly out-of-the-money 119.50 (Feb 23) calls bring in $0.31. If TLT rallies immediately, fine, the position gets called away for a profit of $1.10. Else, the effective cost drops to $118.40. The purpose here is to stay long but also generate income.
Thanks for reading!
