Two-year Treasury yields – supposedly the most sensitive to Fed policy – are acting as if they are beginning to price in a December hike. On October 14th, the two-year Treasury bill yielded 0.57 percent; by November 6th, the yield had risen to 0.9 percent.
The shorter end of the yield curve is responding to constant talk of late by FOMC members – most of them anyway – that they are ready for a hike come December. Ditto with the FOMC minutes yesterday. They meet on the 15th-16th next month.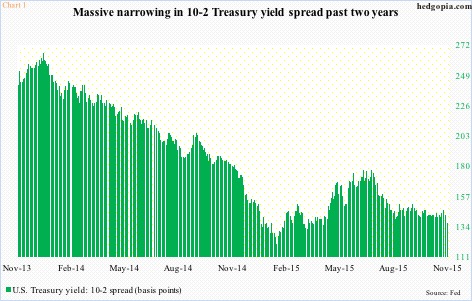
If the Fed does indeed move in a month’s time, it is too soon to say if the long end of the curve will go along for the ride. It is possible bond vigilantes will have a different opinion. In this scenario, the curve ends up narrowing, rather than steepening, which is what the majority of investors as well as financial stocks are currently anticipating. Banks, which borrow short and lend long, prosper if the curve steepens, not so if the reverse occurs.
Over the past two years, the 10-2 spread has undergone massive narrowing (Chart 1).
Two years ago to the day, the 10-year was yielding 2.67 percent, and the two-year 0.31 percent. Yesterday, they respectively yielded 2.27 percent and 0.9 percent. Back then, the U.S. unemployment rate was seven percent; last month, it was five percent. Back then, non-farm employment was 137.4 million; in October, it was 142.7 million. In 4Q13, real GDP was $15.8 trillion; in 3Q15, it was $16.4 trillion.
One would have thought the 10-year would be yielding more.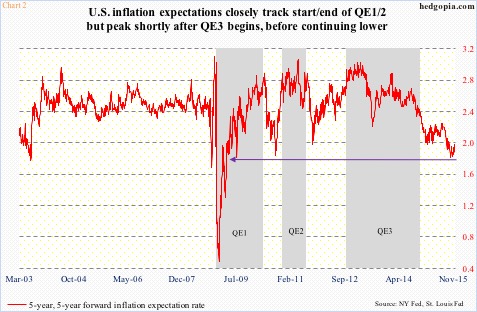
One simple explanation for this is the inability of inflation to shoot up, despite all the monetary stimulus, including three iterations of quantitative easing and the prevailing zero interest-rate policy. Sure, QE has boosted asset prices, but not consumer inflation – at least the ones measured by the government.
Markets are not pricing it in either. Five-year inflation expectations five years from now are languishing below two percent. In fact, the red line in Chart 2 peaked just under three percent in the early months of 2013 – shortly after QE3 got underway.
Or it could simply be bond vigilantes’ way of saying ‘don’t you dare’. In other words, the U.S. economy is not strong enough to cope with higher rates. Hence the persistent bidding under bonds, and the resulting low yields on the long end.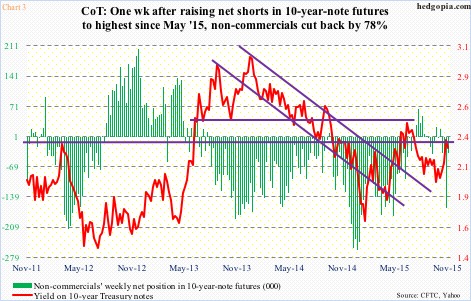
In the futures market, non-commercials are lacking the conviction to persistently stay net short in 10-year-note futures. Since staying net short for two straight years, they have been vacillating between net short and net long since July this year. Early this month, the green bars in Chart 3 saw a sharp spike week-over-week, only to reverse a week later.
Similar sentiment is reflected in how shorts are positioned in TLT, the iShares 20+Year Treasury Bond ETF. At the end of June, short interest peaked at 20.8 million shares, before coming under sustained pressure and dropping to 16.4 million three months later. End-October was 18.6 million. At the end of November last year, short interest was 24 million (Chart 4).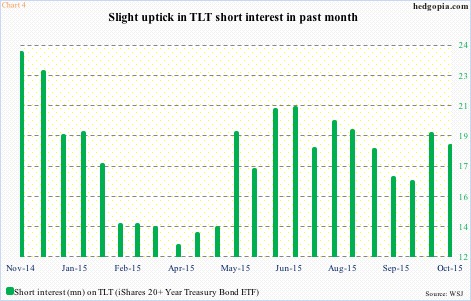
While low short interest takes away the possibility of short squeeze, thereby putting upward pressure on TLT, the fact remains that the collective wisdom of markets is not betting on a meaningful rise in long-term rates.
And we are seeing it over and over. After a 37-basis-point rise in 10 sessions ended November 9th, the 10-year yield is in the process of unwinding overbought conditions, particularly daily.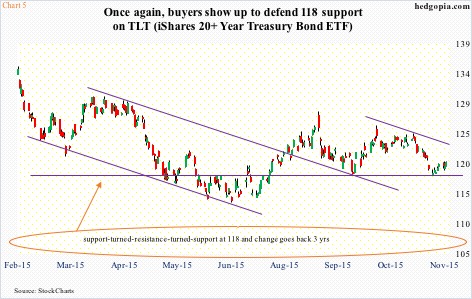
This is creating opportunity in TLT. The November 9th peak in the 10-year yield coincided with TLT finding support – once again – at 118-ish. This support goes back three years, and has proven to be an important battle line between bulls and bears (Chart 5).
To be clear, TLT (120.02) is below both its 50- and 200-day moving averages. So it is tough to get wildly bullish. But using options, it is possible to either go long just above support or generate income.
Hypothetically, November 27th 119.50 puts fetch $0.54. If put, it is a long at 118.96. Else, the premium is kept.
Thanks for reading!

