
Traders are positioning for a Santa rally, but they are trying to play it safe.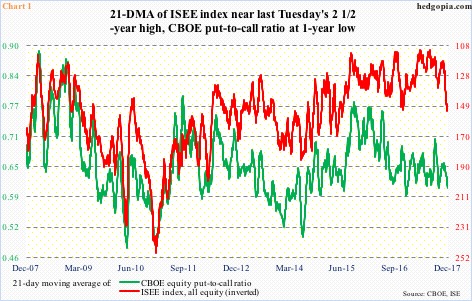
Intraday over the last six sessions, VIX (9.58) collapsed five points, in the process also losing shorter-term moving averages, as well as the 50- and 200-day. The latest spike was used as an opportunity to slam volatility – rightly thus far.
In 10 out of last 15 sessions, the CBOE equity put-to-call ratio registered readings in 0.50s, with the other five in low- to mid-0.60s. This is complacent, but has proven to be the right strategy thus far.
The 21-day moving average of the ratio last Friday dropped to a one-year low 0.604 (Chart 1).
In the meantime, the ISSE index (equity) last Tuesday stood at 152.6 – the highest since June 2015 – with Friday at 151.
(The ISEE index – a call-to-put ratio – excludes trades from market makers and broker/dealers, and only uses opening long trades. From the sentiment perspective, it is considered a cleaner number.)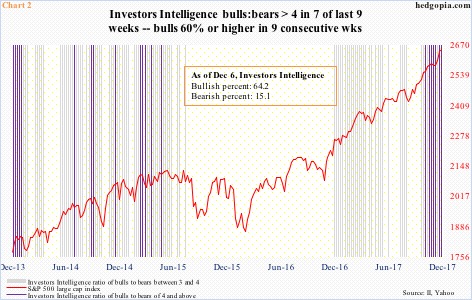
Newsletter writers continue to be bullish – aggressively at that.
Last week, Investors Intelligence bulls were 64.2 percent, a hair’s breadth away from 64.4 percent four weeks ago – which was the highest going back to at least January 1990.
These bulls have been 60 percent or higher in the last nine weeks. The ratio of bulls to bears has been four or higher in seven of the last nine, with the other two 3.95 and 3.99 – essentially four (Chart 2).
The point is, there is giddiness in the air.
And flows are cooperating.
Month-to-date through last Thursday, SPY (SPDR S&P 500 ETF) took in $4.6 billion (courtesy of ETF.com). Another $864 million went into IVV (iShares core S&P 500 ETF), while VOO (Vanguard S&P 500 ETF) lost $515 million.
During the same period, $1 billion moved into IWM (iShares Russell 2000 ETF). IJR (iShares core S&P small-cap ETF) took in another $166 million. QQQ (PowerShares QQQ trust), however, lost $959 million.
In the week ended last Wednesday, U.S.-based equity funds attracted $3 billion. Flows have been positive in eight of the last nine, totaling $32.4 billion (courtesy of Lipper).
In the meantime, as of last Tuesday, non-commercials aggressively upped net longs in both e-mini S&P 500 futures and Russell 2000 mini-index futures – up 54.4k and 34k contracts week-over-week, respectively. Net longs in Nasdaq 100 index (mini) futures, however, went up only 493 contracts w/w.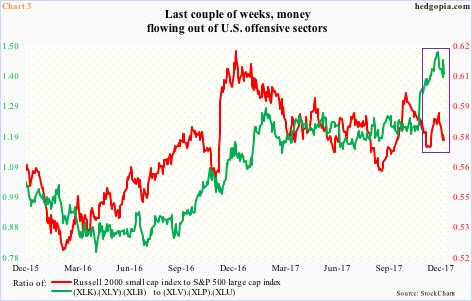
Amidst all this bullish bias, there is this.
Chart 3 plots two ratios – one pinning the Russell 2000 small cap index against the S&P 500 large cap index and the other offensives versus defensives. The latter uses six SPDR S&P 500 ETF’s. XLK (technology), XLY (consumer discretionary) and XLB (materials), which are considered offensive sectors, are pitted against defensives such as XLV (health care), XLP (consumer staples) and XLU (utilities).
Both the red and green lines in the chart peaked late November. Last Friday, when U.S. stocks enjoyed a nice session, they both inched lower.
This probably suggests that these traders expect a rally to unfold in a seasonally favorable period, but would not expect that to last much longer, hence the desire to play it through defense.
This may change, of course. As we saw above, flows are beginning to move into IWM, and non-commercials are beginning to get aggressive.
But right here and now, small-caps are lagging large-caps, and defensives are leading offensives.
Thanks for reading!
