
Following futures positions of non-commercials are as of December 5, 2017.
10-year note: Currently net long 14.3k, down 109.6k.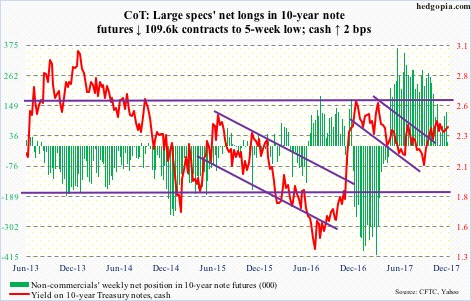
On Tuesday next week, a two-day FOMC meeting begins. This is the eighth – and last – meeting this year. A hike is priced in, with the futures market assigning 90-percent odds to a 25-basis-point increase. This will be a third 25-basis-point increase this year, and fifth since December 2015.
Next year, the dot plot expects three more. How likely?
There are seven seats on the Federal Reserve board. (This, plus seven Fed district presidents make up the FOMC.) President Trump has so far nominated three, including Jerome Powell, who, once confirmed, will replace Janet Yellen as Fed chair. Randal Quarles has already been confirmed as a member, while Marvin Goodfriend’s awaits confirmation. There are three more seats needing to be filled.
The FOMC next year will look a whole lot different.
If, however, the Powell-led Fed continues to tighten next year, 10-year yields (2.38 percent) will probably continue to rebel.
The long end of the curve has refused to go along with the short end. The last time 10-year yields tried to break through 2.6 percent was in March this year – which is where these yields will break out of a three-decade-old descending channel.
This Tuesday, the yield curve (10s/2s) narrowed to merely 53 basis points – the lowest since October 2007 – before rising a tad to 58 basis points by Friday. At this rate, it does not take long for it to invert, which then will get reflected in stocks – lower, of course. This is precisely what is likely to lead the new FOMC to begin to look for excuses not to go down the path forecasted by the current dot plot.
30-year bond: Currently net long 74.5k, up 10.6k.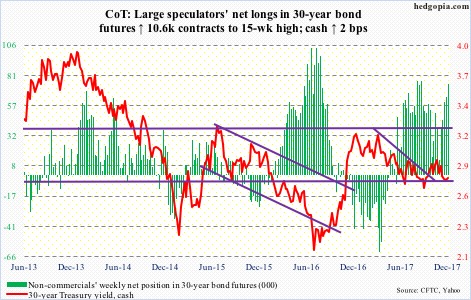
Major economic releases next week are as follows.
JOLTS for October will be published Monday. In September, non-farm job openings inched up 3,000 month-over-month to 6.09 million. A record 6.14 million was reached this July.
The NFIB optimism index (November) and PPI-FD (November) come out Tuesday.
In October, small-business optimism increased eight-tenths of a point m/m to 103.8. This was the 11th consecutive reading of 100-plus. Optimism reached a 13-year high 105.9 in January this year.
Producer prices rose 0.4 percent m/m in October. In the 12 months through October, the PPI-FD jumped 2.8 percent. Core PPI rose 0.2 percent m/m and 2.3 percent in the 12 months to October.
November’s consumer price index is scheduled for Wednesday. CPI and core CPI in October inched up 0.1 percent and 0.2 percent m/m, respectively. In the 12 months through October, they respectively rose two percent and 1.8 percent.
Retail sales for November are due out Thursday. October inched up 0.2 percent m/m to a seasonally adjusted annual rate of $486.6 billion. Year-over-year, they rose 4.6 percent.
Friday brings industrial production (November) and the Treasury International Capital system data (October).
U.S. capacity utilization rose 0.9 percent m/m to 77 percent in October. Utilization has been creeping up since bottoming at 75.4 percent in March 2016. The cycle high of 79.2 percent was reached in November 2014.
On a 12-month rolling total basis, foreigners switched from net sellers to net buyers of U.S. stocks in January. As of September, their purchases totaled $78.4 billion. This is quite a turnaround from February 2016 when they were net-selling $145.3 billion worth.
Crude oil: Currently net long 654.7k, up 3.7k.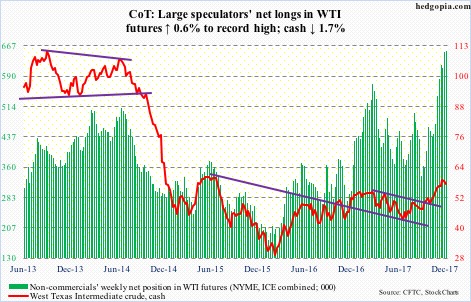
The ‘buy the rumor, sell the news’ phenomenon is likely playing out in oil.
Spot West Texas Intermediate crude ($57.36/barrel) was not able to rally on OPEC’s (and Russia’s) extension last week of their existing crude production cut of 1.8-million barrels per day beyond March next year to December.
Nonetheless, support at $54-55 is intact, which the bears need to take out to build downward momentum. On the weekly chart, there is plenty of room for the crude to continue lower.
Pressure builds once non-commercials – the most bullish ever – decide to reduce net longs.
The EIA report for the week of December 1 showed continued increase in U.S. crude production, which rose another 25,000 b/d to 9.71 mb/d. Since the OPEC deal in November last year, U.S. production has gone up by one mb/d.
Both gasoline and distillate stocks increased, up 6.8 million barrels and 1.7 million barrels to 220.1 million barrels and 129.4 million barrels, respectively.
Crude stocks, however, dropped 5.6 million barrels to 448.1 million barrels. As did crude imports, which dropped 127,000 b/d to 7.2 mb/d.
Refinery utilization rose 1.2 percentage points to 93.8 percent.
E-mini S&P 500: Currently net long 166.9k, up 54.4k.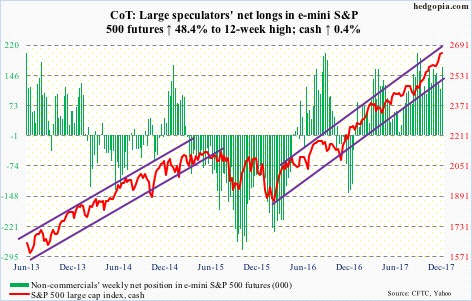
The bulls put money where their mouth is – likely in anticipation of seasonality-driven strength. Non-commercials’ net longs rose to a 12-week high.
In the week through Wednesday, SPY (SPDR S&P 500 ETF) took in $5.5 billion (courtesy of ETF.com). Another $1.1 billion went into IVV (iShares core S&P 500 ETF), while VOO (Vanguard S&P 500 ETF) lost $258 million.
In the same week, U.S.-based equity funds attracted $3 billion. Flows have been positive in eight of the last nine, totaling $32.4 billion (courtesy of Lipper).
The bears had a small opening this week, as the cash began with a hard reversal on Monday, but were unable to take out the 10-day, let alone the 20.
Euro: Currently net long 93.1k, up 3.4k.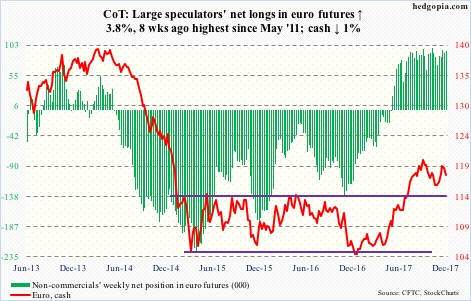
The cash ($117.73) this week developed a potentially bearish daily MACD cross-under. On the daily chart, there is room for continued downward pressure, particularly if the 50-day ($117.58) gets taken out, in which case support at just under $117 takes on significance.
The currency has come under pressure since peaking on September 8 at $120.69. Resistance around that level goes back nearly two decades.
Gold: Currently net long 173.3k, down 51.1k.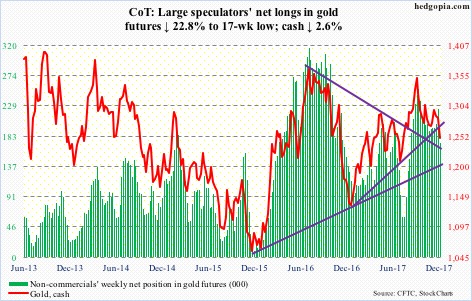
After defending the 200-day on the cash ($1,248.40/ounce) for over a month, the bulls caved in this week. The average was lost. As was a rising trend line from December 2016. Another trend line drawn from November 2015 draws to $1,200.
Non-commercials cut back net longs by 22.8 percent.
In the week to Wednesday, both GLD (SPDR gold ETF) and IAU (iShares gold trust) did attract funds – $256 million and $11 million, respectively (courtesy of ETF.com), but was not enough.
Gold bugs’ inability to break through $1,300 on November 28 likely set the foundation for this breakdown.
The daily chart is oversold. In a worse-case scenario, support at $1,200 – or thereabouts – could be in play.
Nasdaq 100 index (mini): Currently net long 6.1k, up 493.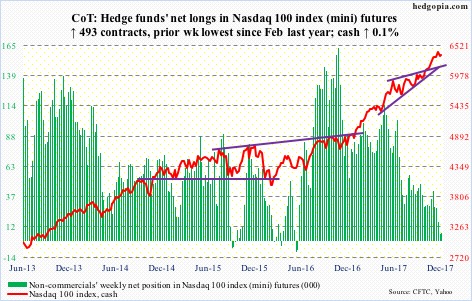
After suffering nasty sell-offs in two out of last eight sessions, it was looking increasingly likely that short-term support at 6130 would be tested on the cash (6344.57). But the bulls put their foot down 100 points before that, defending the daily lower Bollinger band.
In the subsequent rally, the 10- and 20-day were recaptured. As long as this holds, favorable seasonality favors the bulls.
Flows continue to be tentative, though. QQQ (PowerShares QQQ trust) in the week through Wednesday lost $712 million (courtesy of ETF.com).
Russell 2000 mini-index: Currently net long 40.7k, up 34k.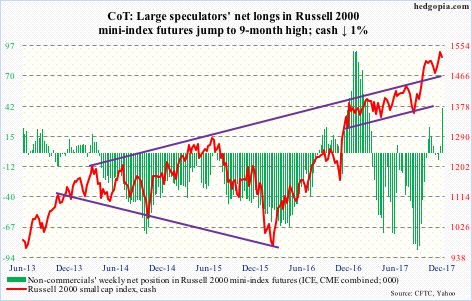
The cash (1521.72) suffered a nasty reversal on Monday, but the bulls also showed up where they must have. The 20-day, which also approximates the 50-day (1503.82), was defended both Wednesday and Thursday.
In the week through Wednesday, $2.3 billion moved into IWM (iShares Russell 2000 ETF). IJR (iShares core S&P small-cap ETF) took in another $155 million (courtesy of ETF.com).
Non-commercials aggressively went net long.
The bulls need to take out the 10-day (1527.35) for continued momentum. Friday’s rally faded right at that level.
US Dollar Index: Currently net short 8.5k, down 2.1k.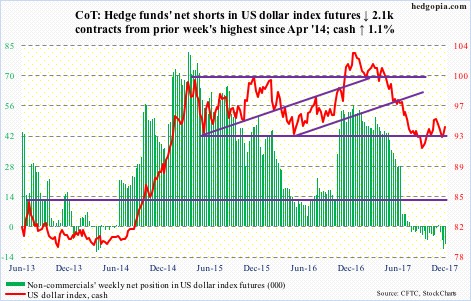
After defending support at 92-93 last week, dollar bulls rallied the cash (93.87) in all five sessions this week, past the 50-day.
Non-commercials are still not on board.
There is resistance at 94 and change. Friday, the dollar index rallied to 94.07 intraday before retreating.
VIX: Currently net short 114.6k, down 191.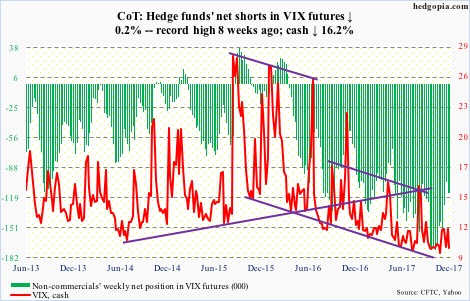
Turns out the candle on December 1, when the cash (9.58) shot up to 14.58 intraday but closed up 0.15 to 11.43, was a spike reversal anyway. In the subsequent selloff, VIX lost both 50- and 200-day.
The daily lower Bollinger band lies at 9.07.
In the meantime, in 10 out of last 15 sessions, the CBOE equity put-to-call ratio registered readings in 0.50s, with the other five in low- to mid-0.60s. The bulls are positioned up to the gills for expected seasonal strength in equities. Santa better not disappoint.
Thanks for reading!
