
From last week’s Thursday close through this Monday, the US dollar index jumped 3.4 percent. This was the sharpest two-session increase since it rallied 3.6 percent on September 29, 1992. That is how far back one has to go in order to find a comparable rise.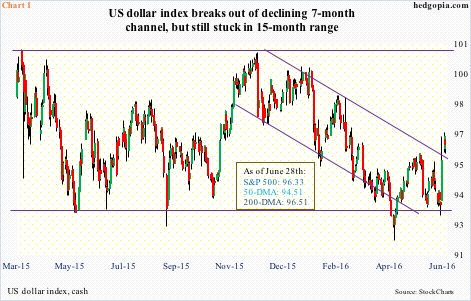
The two-day surge put the index past its 200-day moving average, but barely, which it lost yesterday, but again barely. With daily overbought conditions, it is currently just under the average.
Even after the two-day jump, the dollar index is stuck in the middle of a 15-month range. Last Thursday, it dropped all the way to 93.03 to test the lower bound of that range before reversing with a hammer (Chart 1). The subsequent two-day surge had it break out of a seven-month declining channel.
This is a powerful move, with room to rally still on a weekly chart. The index just completed a weekly bullish MACD crossover. Can it go test 100-plus which was unsuccessfully tested early December last year (Chart 1)?
It would help if, rather than guess which way the index is going to go near-term, we reflect on what led to the recent surge.
It was fear-driven, not fundamentals.
The 3.4-percent, two-day move came on the heels of Brexit – an event that sent the sterling tumbling, and the yen, another “safe-haven” currency, rallying.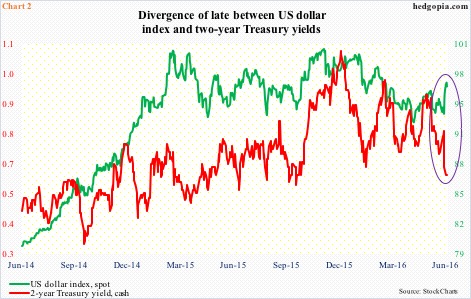
Of late, the dollar index has diverged from two-year Treasury yields. The latter tends to be sensitive to the Fed’s monetary policy forecasts. In turn, the dollar index and short-term rates tend to move in tandem. Until recently, that is.
As the violet oval in Chart 2 shows, the green and red lines diverged sharply last Thursday. Two-year yields dropped from 0.78 percent last Thursday to 0.61 percent on Monday, even as the dollar index rallied. Post-Brexit, rate-hike odds in the U.S. have tumbled, hence the drop in two-year yields, which were 0.92 percent as early as May 25th.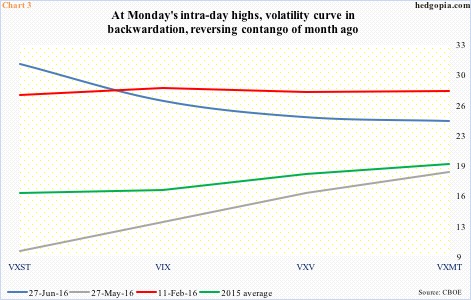
The dollar has rallied for the wrong reasons. Not because the economy is strong, raising prospects for higher rates and a steep yield curve. But because uncertainty post-Brexit has grown. It is a safe-haven play. That is why spot gold rallied a cumulative 5.4 percent in the afore-mentioned two sessions.
And that is why the VXST-VIX-VXV-VXMT volatility curve on Monday was in backwardation using intra-day highs (Chart 3). There was elevated demand for short-term protection, and market participants were willing to fork over a high price for this. This is in sharp contrast to risk-on contango a month ago.
In this scenario, odds of the dollar index testing resistance at 100 at least near term are remote at best. As soon as Brexit fears dissipate, the reason to gravitate toward it weakens, given tentative U.S. data and lesser odds of a rate hike this year.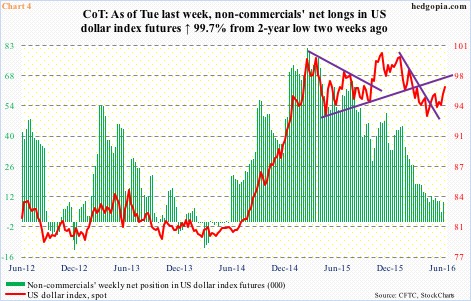
In this respect, non-commercials have been proven right. They built net longs in US dollar index futures all the way to 81,270 contracts in the week ended March 10th last year. The spot peaked on the 16th that month (Chart 1). By June 14th (this year), their holdings had decreased to 4,692 contracts – a two-year low – before rising last week. The spot continues to remain range-bound.
Thus far, these traders do not seem interested in aggressively adding to net longs. Could this have changed post-Brexit win and the two-session rally in the spot? We will find out this Friday. Odds favor they continue to act hesitant, as once again, the rally in question was driven by fear, not fundamentals.
Thanks for reading!
