
Major US equity indices are at/past late-January highs. Investor sentiment, on the other hand, is nowhere near as giddy. Is this good or bad?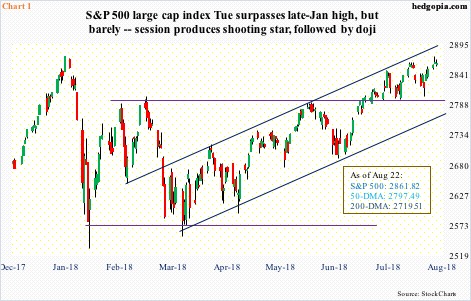
The Russell 2000 small cap index (1722.54) just broke out of a two-month pennant. Of major US equity indices, the Nasdaq 100 index (7424.6) acts a little sluggish, but is only 1.2 percent away from its all-time high from July 25. On Tuesday this week, the S&P 500 large cap index (2861.82) surpassed its prior high of 2872.87 reached on January by less than a point, but managed to establish a new intraday high all the same (Chart 1).
What is not to like?
Even as equity bulls refuse to let go of the ball, some interesting dynamics are in play currently as relates to investor sentiment. How it behaves in the weeks ahead could have huge repercussions for these indices, and others.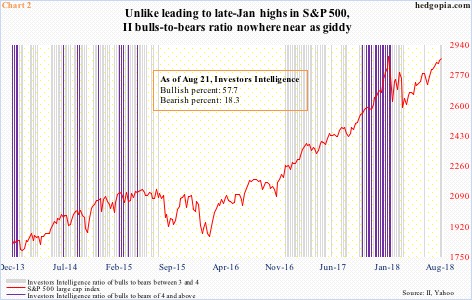
Investors Intelligence bulls this week were 57.7 percent, and bears 18.3 percent. This was the seventh consecutive weeks of bullish percent north of 50 percent. This was also the highest reading in the past 29 weeks. Bullish sentiment is firmly established. But it is nowhere near as giddy as was the case leading up to when US stocks peaked late January before coming down hard into the first week of February. Back then, bulls registered as high as 66.7 percent mid-January. Through the end of January, there were 17 straight weeks of readings in the 60s, even as bears fell to as low as 12.6 percent. Sentiment was outlandishly bullish. Lop-sided would be another word to describe it. This is well reflected in Chart 2. The two bars represent a bull-to-bear ratio of three or above. Leading up to the late-January peak in the S&P 500, the ratio persistently stayed north of four. There is none now. In the past couple of weeks, it has been north of three but below four.
Versus back then, sentiment now is well-behaved. Now, depending on how things shake out in the weeks ahead, the current state of bullishness could help or hurt stocks. Most major indices have surpassed their late-January highs, but sentiment is nowhere near as bullish. On the one hand, this could suggest there is still buying power left. On the other, if new – and newer – highs have not drawn them in, what will?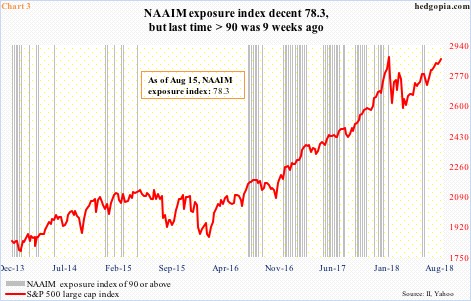
A similar phenomenon is at work elsewhere. The NAAIM (National Association of Active Investment Managers) exposure index represents members’ average exposure to US equity markets. As of last week, it stood at 78.3. This is high, but not high enough to warrant caution. Once again, leading up to the late-January peak in the S&P 500, NAAIM members were north of 90 for several weeks, including two 100-plus readings in December, one of which was a record 120.56. Now, there has not been a 90, or higher, reading in the past nine weeks. Once again, the question is, is this because bulls are all in and there is no ammo left or the cautionary types that sat out the latest rally will eventually get dragged into it? If it is the latter, in due course the Russell 2000 will end up leading the other major indices. If it is the former, watch out. The S&P 500 could double top (Chart 1). For now, Tuesday’s all-time high on the S&P 500 came in a shooting star session, which was then followed by a doji. At least near term, a pause/reversal is due. Six sessions ago, bulls defended breakout retest at 2800. How they react when another test occurs will be telling.
Thanks for reading!
