
Reversing the prior week’s weakness, major US equity indices put up strong performance last week. The S&P 500, for instance, defended a rising trend line from last March. VIX collapsed, landing on low-20s, a breach of which opens the door to the teens, which should pose as an ideal scenario for equity bulls – for now.
This market is very forgiving – kind of heads I win, tails you lose. Strong data plays to optimism that the US economy will come roaring back this year as more and more people get vaccinated. Weak data keeps the hope alive that the Fed will continue to expand its balance sheet. That is the way it has been for a while.
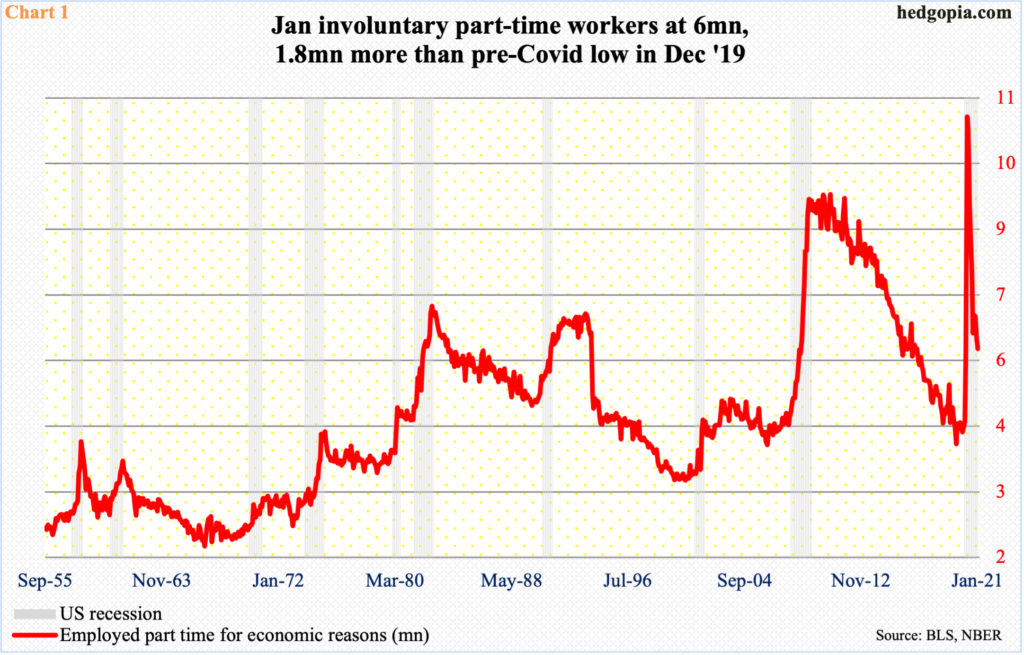
This was evident last Friday. January was a disappointment. Only 49,000 non-farm jobs were created. Ditto with involuntary part-time workers, which pre-pandemic dropped to 4.2 million in December 2019 – and as low as 3.9 million in July that year which was the low of the prior cycle. Then, they shot up, hitting record 10.9 million last April. The metric improved in the subsequent months but only to reach six million by January, which was still 1.8 million more than in December 2019 (Chart 1).
Ahead of this, the S&P 500 had already rallied 4.2 percent for the week. Jobs came in below expectations. No matter. The large cap index ended up 0.4 percent on Friday anyway, as bulls inferred this would ensure a smooth passage for President Joe Biden’s $1.9-trillion stimulus package.
By now, there is already plenty of stimulus in the system. Markets, true to their nature, are craving for more. Not every economist is convinced the economy needs additional stimulus – or, from the big picture perspective, if the nation can afford one at all.
In the 12 months to December, the US budget deficit amounted to $3.3 trillion, versus a tad above $1 trillion last March. In all of last year, federal debt went up $4.5 trillion to $27.7 trillion. Early last March, the Fed held $4.2 trillion in assets, which have now ballooned to $7.4 trillion.
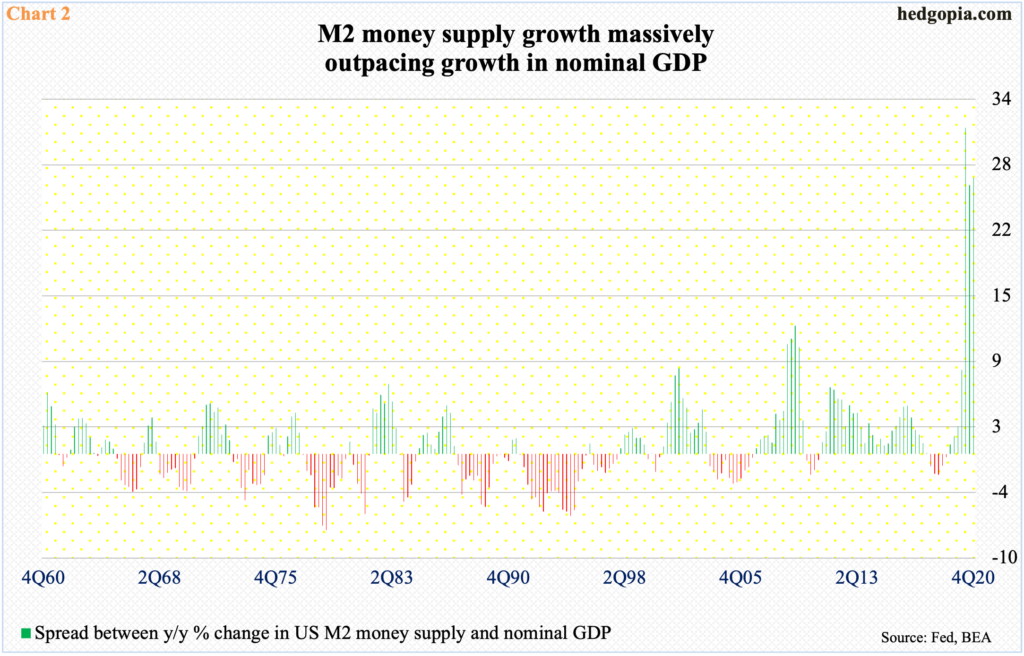
Not surprisingly, growth in the M2 money supply has gone parabolic. Since last March, it has grown in double digits every month, with the last eight months to December growing in the 20 percent range.
At the end of 2019, nominal GDP was $21.7 trillion. By the end of 2020, this was essentially unchanged at $21.5 trillion, having earlier tumbled to $19.5 trillion in 2Q. M2, in contrast, went from $15.3 trillion in 4Q19 to $19.1 trillion in 4Q20.
Chart 2 calculates the difference between growth rates in the M2 money supply and nominal GDP, and the picture could not be clearer. There is already too much money sloshing around in the economy.
The hope is that this acts as dry powder, lighting a fire under economic activity this year. Should things evolve this way, this would, of course, translate into earnings.
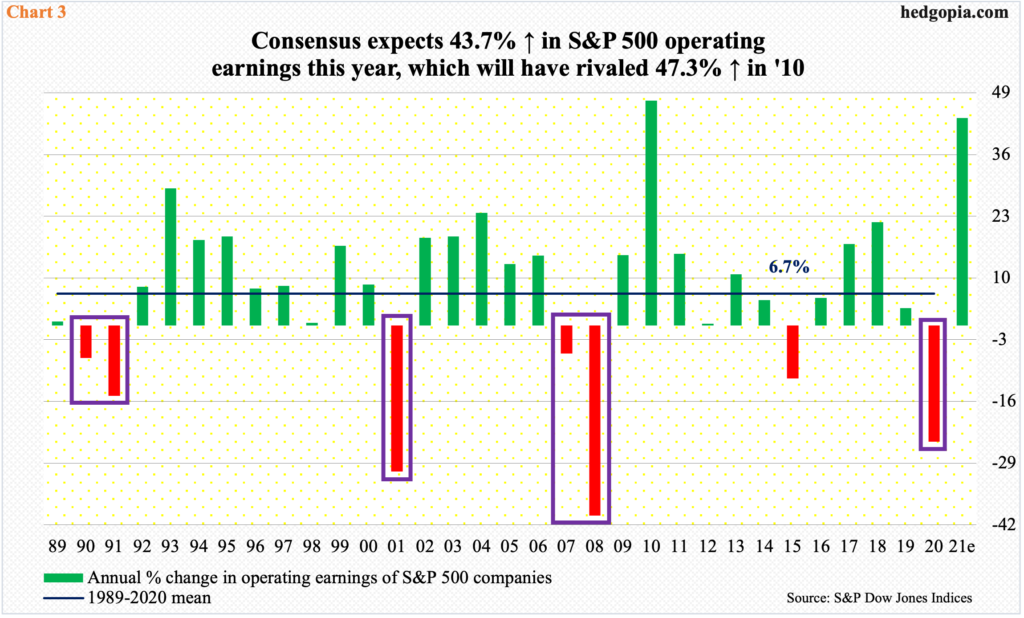
The sell-side is gung-ho about this year’s prospects. With nearly 73 percent of S&P 500 companies having reported, blended 4Q20 operating earnings were $34.50 as of last Thursday. If this holds up, earnings will have come in at $118.69 in 2020, down from $157.12 in 2019.
Things are expected to improve by orders of magnitude this year, as the sell-side has penciled in $170.55. Should these expectations come through, this would represent 43.7 percent surge over 2020. This will be the steepest growth rate since surging 47.3 percent in 2010 (Chart 2). These growth rates are not normal. Going back to 1989, the average annual growth rate has been 6.7 percent. Besides, the drop in earnings during the Covid-19 recession was softer than in at least the prior three recessions.
This has created an environment where dips are consistently viewed as opportunities to load up.
January began where 2020 left off. Through the 26th intraday high, the S&P 500 was up 3.1 percent for the month. Then, selling hit. By the time the month was over, the index was down 1.1 percent. The so-called January barometer, which posits that as goes January so goes the year, was predicting a tough year, although the index was up in the first five sessions (the five-day rule); plus, not all major equity indices were down in the month (more on this here).
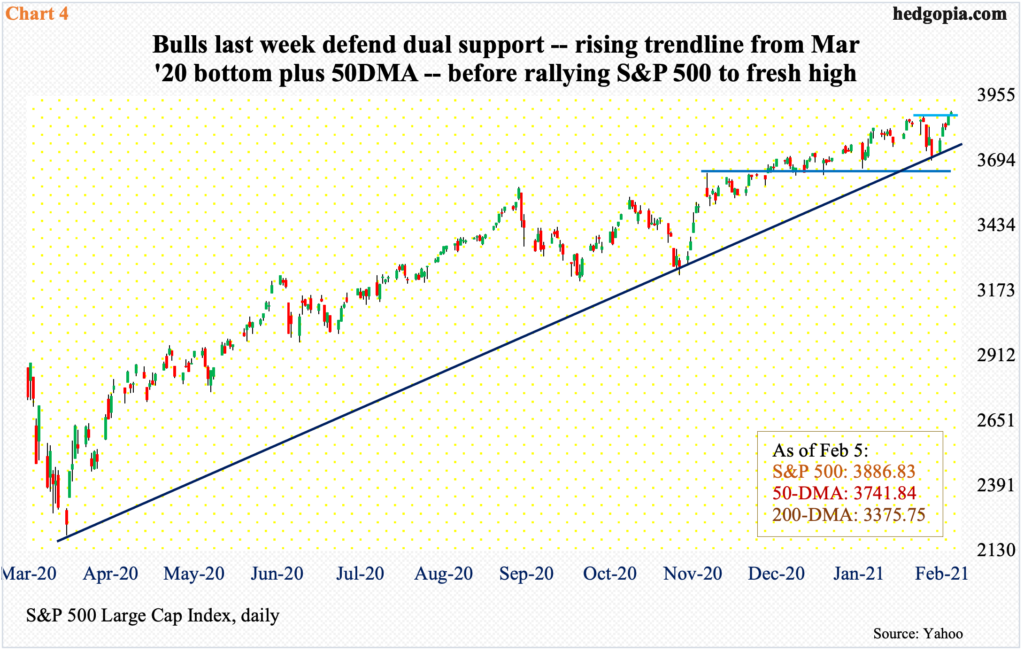
Importantly, the S&P 500, as well as the Nasdaq 100, ended January right on trend-line support from last March when they put in major lows. In the S&P 500’s case, the trend line approximated the 50-day moving average as well. This was an opportunity for bears to shift momentum to their favor but could not deliver. The index (3886.83) shot up 4.7 percent last week, rallying in all five sessions, including the aforementioned Friday, to a fresh high (Chart 4).
In the wake of the low last March, broken resistance has persistently provided support. Immediately ahead, bulls now have new short-term support at 3870s on the S&P 500 (Chart 4). If this level attracts bids this week, VIX is the one to watch.
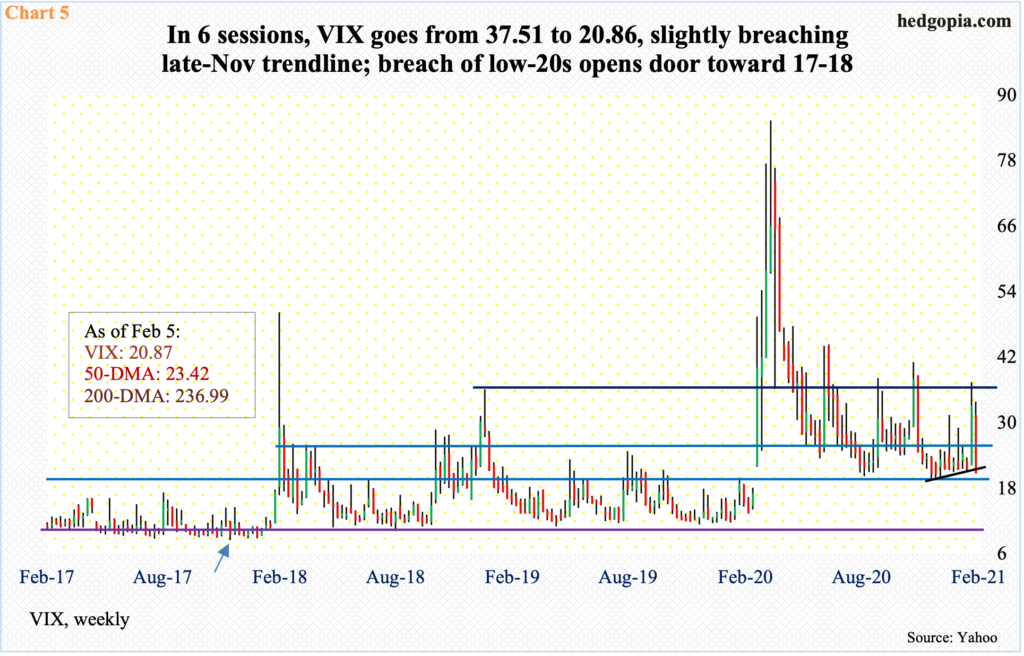
Last week, the volatility index cratered, down 36.9 percent. Equity bulls were as quick to take on risk as they were to seek protection in the prior week when VIX tagged 37.51 intraday on the 29th, before dropping in all five sessions last week, with three red marubozu candles.
With this, VIX (20.87) is clinging on to low-20s, which has refused to give way the past six months but is vulnerable (Chart 5).
From late November last year, VIX made higher lows. Last week, that trend line was breached, albeit slightly. If low-20s goes, then the first layer of support lies at 17-18. Before VIX surged a year ago, when it peaked at 85.47 in March, it routinely found support at 11-12. Its all-time intraday low of 8.56 was recorded in November 2017 (arrow in Chart 5).
The point is, it can act as a self-fulfilling prophecy if low-20s is decisively breached.
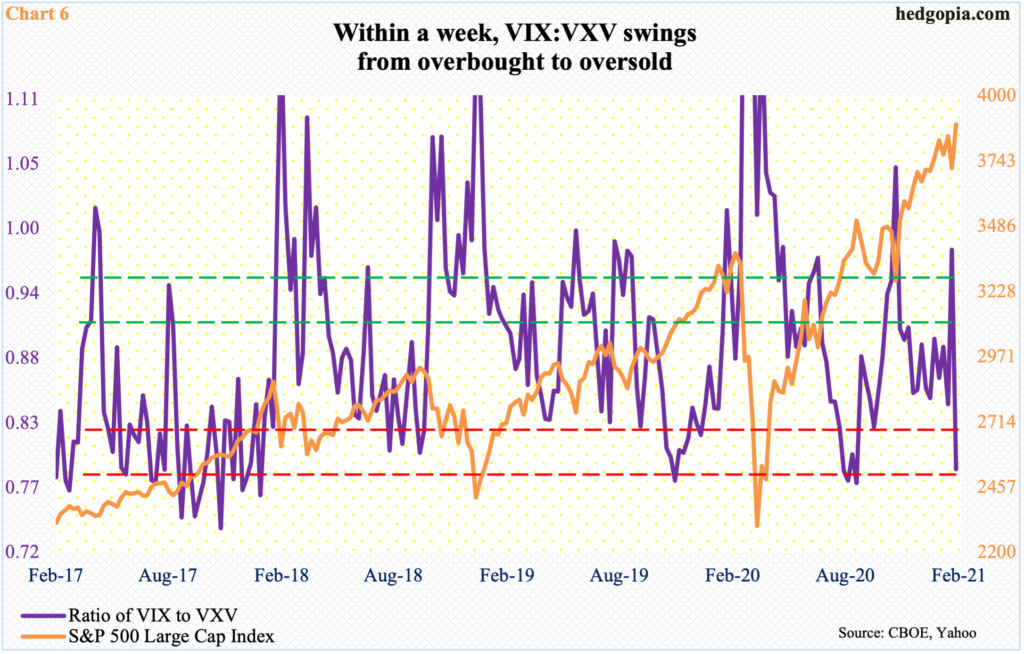
In this scenario, the ratio of VIX to VXV either goes sideways or still heads lower.
VIX measures market’s expectation of 30-day volatility on the S&P 500. VXV does the same, except it goes out to three months. When investors are in risk-off mode, demand for nearer-term protection goes up, which gets reflected in the ratio, as VIX rises more than VXV. The opposite occurs when sentiment shifts to risk-on, which was the case last week.
At 0.79 last Friday, the ratio already is in oversold territory (Chart 6). That said, several times in the past, the ratio has remained suppressed to go sideways, helping equities. The first indication of volatility unfolding this way is if volatility bulls are unable to defend low-20s on VIX.
Realistically, nothing says the current frenzy cannot go on. Several metrics already have, including margin debt (chart here) and foreigners’ purchases of US stocks (chart here), not to mention what is transpiring in the options market.
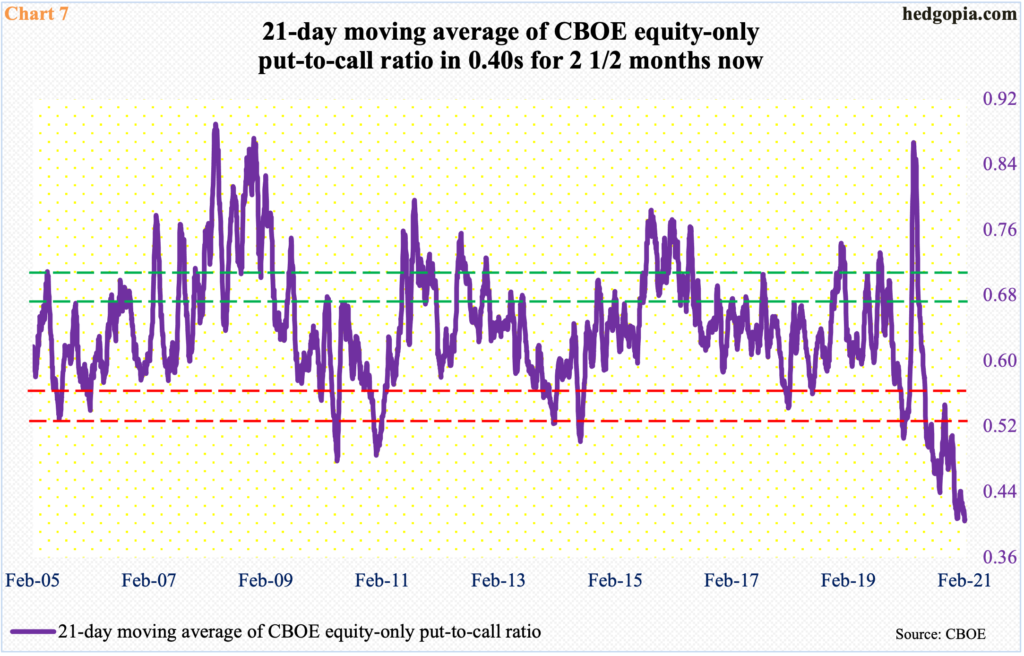
The demand for calls versus puts is so lopsided that the 21-day average of the CBOE equity-only put-to-call ratio has remained sub-0.40s since November 20 last year (Chart 7). Historically, it routinely reversed from low-0.50s, and high-0.40s on occasion.
This time around, the ratio just made a new low of 0.405 last Thursday. Giving equity bulls credit where it is due, the call buyers have been on the right side of momentum for a while now. This may very well have created a false sense of security.
If past is prelude, the current condition will unwind – just a matter of when not if.
Leading up to the vicious February-March selloff last year, investor optimism was similarly elevated; on January 17, the ratio dropped to 0.506 and then to 0.531 on February 11. Then the pandemic hit, and the ratio in a matter of five weeks surged to 0.867 by March 20 – a record. Fear was palpable back then, the unwinding of which led to the massive rally in stocks that followed – and to the current greed phase. This will unwind, too.
But before that happens, distribution has to begin in earnest on the S&P 500, and other indices, and volatility should bottom. There have been signs of distribution here and there but nothing durable. If VIX ends up losing low-20s and heads toward the teens, that will have to wait for now.
Thanks for reading!
